In April, markets continued their strong start to 2023, supported by solid corporate earnings, key macroeconomic data, and the ongoing resolution of several failed banking institutions. While there were a few exceptions, overall, the markets performed well.
April is one of the few months when the Federal Open Market Committee (FOMC) does not convene to discuss monetary policy. This hiatus allowed market participants additional time to analyze data and anticipate future developments. For now, the health of U.S. consumers and corporations seems to indicate that today’s 0.25% rate increase is the final step in the Fed’s 14-month quest to combat the highest inflation in four decades. The outcome of this policy action will be monitored closely to determine what additional steps follow.
In this edition of Insights, we review recent market performance, assess the health of the U.S. economy, examine corporate America’s quarterly earnings, and provide commentary on the ongoing debt ceiling negotiations.
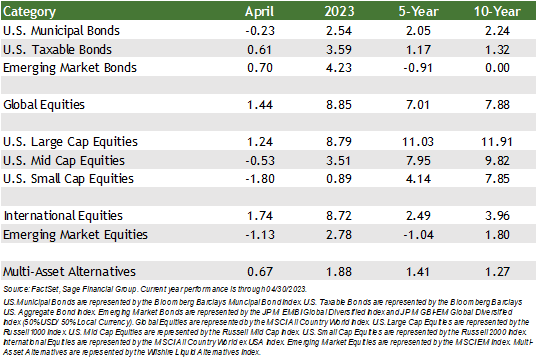
Diversification, both domestically and internationally, proved beneficial in April.
- High-quality bonds rose 0.61% in April amidst falling yields, furthering year-to-date returns of the Bloomberg U.S. Aggregate Bond index to 3.59%. Likewise, emerging market debt increased by 0.70%, bringing the year-to-date return to 4.23%.[3]
- Similar to what we saw in March, equity markets gained in aggregate but exhibited divergent performance:
- U.S. large-cap stocks rose in April by 1.24%, driven by stronger-than-anticipated earnings reports from large technology companies. Conversely, the more financial sector-heavy U.S. small-cap stock index fell by 1.80% as market participants continued to take stock of the uncertainty regarding smaller, regional banking institutions.
- International stocks were also divided in April. The most widely quoted international stock index moved higher by 1.74%, but emerging market equities fell 1.13% as geopolitical tensions contributed to investor unease. Developed market large-cap stocks showed similar dynamics to their U.S. peers with strong earnings figures in Q1, driven by increased demand from Chinese consumers.
Assessing the Health of the Economy
Over a month since the initial turmoil in the banking sector, investors remain focused on the health of the U.S. consumer and the broader economic landscape. Although the Federal Reserve did not convene in April, the impact of a higher interest rate environment persistently reverberates throughout the economy.
Just as the word transitory became maligned in 2022, a continued discussion amongst market participants today is focused on the potential of a recession. However, the most suitable answer to that question depends on who you ask and when you ask.
In April, the CEOs of some of the largest U.S. banks weighed in on the discussion. CEO of J.P. Morgan Chase Jamie Dimon last year told a room of investors and analysts, “You know, I said there are storm clouds, but I’m going to change it … it’s a hurricane. While conditions seem ‘fine’ at the moment, nobody knows if the hurricane is a minor one or Superstorm Sandy.”[1]
Fortunately, our outlook continues to be that the economic storm may be a “minor one.” Overall, Dimon’s tone has been more reserved lately as his firm posted strong earnings results to start the year, and the CEO noted in a more recent commentary that corporate credit remains firm.
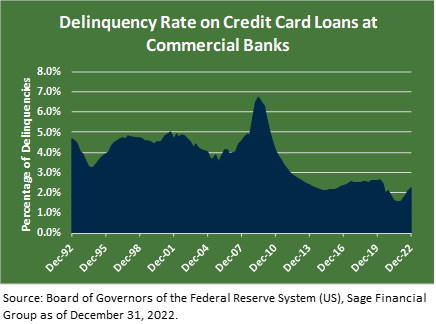
Wells Fargo CEO Charles Scharf added, “Consumer spending remains strong with growth in both debit and credit card spend, but spending began to soften late in the quarter.”[2] This is consistent with data from the Federal Reserve, which recently showed that 2.25% of U.S. consumers have entered delinquencies on credit card spend. As shown below, the delinquency rate is far below what was seen in recent history and drastically below the 7% peak delinquency rate in 2008. This information reinforces our view that today’s environment is very different from the Global Financial Crisis in 2007-09.
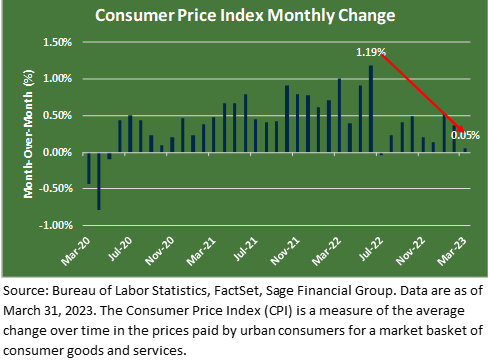
U.S. inflation data shows a gradual slowdown in the Consumer Price Index. Last month’s 0.05% monthly increase marked the second smallest increase in nearly three years. At today’s Fed meeting, the Federal Open Market Committee (FOMC) increased its target rate by 0.25% to emphasize that the battle against inflation is not over.
Recent FOMC meeting minutes show that voting members have reduced their rate expectations for later this year due to March’s banking volatility. In the coming months, we believe the Fed will likely keep rates elevated but halt further increases.
From a portfolio perspective, we expect this anticipated pause in interest rate hikes will support traditional bonds and stocks. We expect bonds to typically provide stable income within investment portfolios, an aspect investors have often overlooked during this last decade, with interest rates at historic lows. If the FOMC determines that the economy is beginning to show signs of weakness, it could justify future lower interest rates. All else equal, lower rates translate to higher bond prices and would add a component of total return.
Regarding equities, we remain cautiously optimistic about stocks. Global stock markets appear to have factored in much of the adverse economic news, resulting in fair valuations. However, global corporate profitability must adapt to a higher interest rate environment. Our strategy continues to involve owning equities across geographies and market capitalizations while avoiding “hot” investment themes like meme stocks and pockets of the market that are excessively priced.
What to make of this Corporate Earnings Season?
The quarterly earnings season has begun better than previously anticipated. With around 25% of the S&P 500 companies providing first-quarter results through April, performance has exceeded that of the preceding two quarters.
Although each company and industry have nuanced differences, these results are encouraging and offer little indication of a rough road ahead for the broader economy. In April’s final week, 180 S&P 500 companies reported results for the first quarter, including influential companies impacting our day-to-day, such as Microsoft, Meta Platforms (Facebook), and Alphabet (Google).
- Microsoft invested an additional $10 billion in OpenAI in January, a company best known for developing the artificial intelligence tool ChatGPT. This multi-year investment is designed to create synergy between the two companies managing significant volumes of data.
- Amazon continues to be positioned as a leader in eCommerce, digital advertising, and cloud. Although Amazon Web Services, the company’s most profitable unit, displays some signs of cooling, the transition to cloud computing is still in its early stages.
- Alphabet reported strong results in core search, YouTube, and cloud segments of the business. Additionally, the company announced a $70 billion buyback for shareholders.
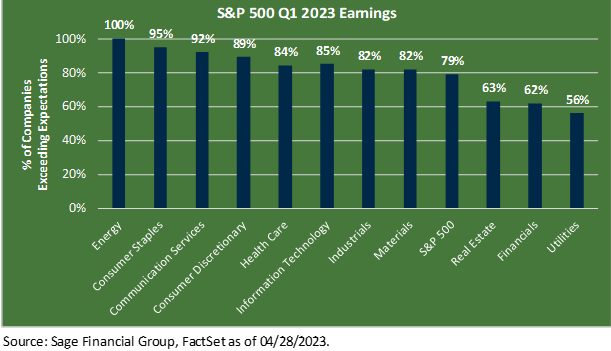
On average, 79% of S&P 500 companies reporting earnings thus far have exceeded analysts’ profit forecasts for profit. This is greater than the 10-year average of 73%, and by sector, energy, consumer staples, and communications services have the highest percentages of companies reporting earnings above estimates.
From a market perspective, as we have noted in prior communications, stock returns historically lead the economy. In other words, stocks typically decline in anticipation of a slowdown and rally before the recovery begins. In fact, many challenges facing corporations, such as higher input prices and wage pressure, are beginning to abate. As a result, fewer companies on earnings calls are citing labor shortages as a key factor impacting profitability.
Nobody can predict short-term results for stocks, but it is increasingly likely that stocks may move somewhat sideways for now. U.S. large-cap stocks’ returns through April 2023 are just below 8.8%. While this four-month return remains below the average annual return since 1990, history shows that combining stocks and bonds over time has demonstrated effective diversification.
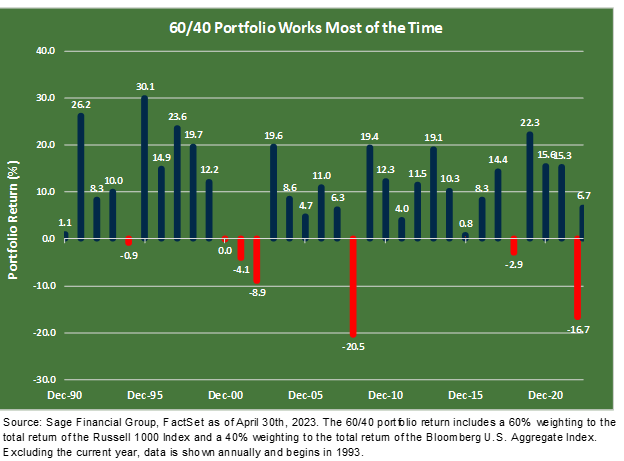
Your investment objectives are unique to you, with specific goals you aim to achieve. A portfolio comprising a mix of stocks and bonds is designed to be resilient through diverse market conditions, though annual fluctuations are expected. Stocks act as the primary growth driver for long-term results but exhibit greater return variability. In contrast, bonds typically offer stability and income under normal market conditions, helping to cushion portfolios and achieve near-term objectives with higher probability.
Historical Perspective: Navigating Through Debt Ceiling Negotiations
In January, the United States Government hit the current $31.4 trillion debt limit, prompting the Treasury Department to employ “extraordinary measures” to avoid a default.
However, as we shared at the beginning of the year, reaching the debt ceiling deadline does not indicate that the U.S. is defaulting on its debt. This issue has become politically charged, with members from both parties within the House and Senate disagreeing on the best path forward. If the ceiling is not raised, the U.S. may be unable to borrow further by June.
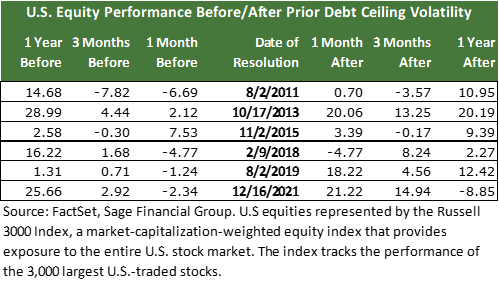
Historically these events have caused market volatility leading up to this “X date.” Financial markets do not view uncertainty in a favorable light and hope to see a resolution of the debt ceiling as soon as possible. As shown in the table below, U.S. equities (as measured by the Russell 3000 Index) typically decline leading up to a resolution before rebounding in the following month by an average of 9.80%.
We design investment portfolios to incorporate a range of asset classes that exhibit diverse performance across various market conditions. For example, fixed income and international equities are two asset classes that should provide investors with diversified exposure through ongoing debt ceiling negotiation volatility. With that in mind, over an investable time horizon, we anticipate that each portfolio component contributes, but global equity exposure provides the engine of portfolio growth.
We believe it could be a bumpy road ahead, but we would be surprised to see a U.S. default. Since 1960, the debt ceiling has been increased 78 times under both party administrations and congressional majorities. We could see a resolution occur within the final hour and advise against drastic portfolio adjustments, as history suggests a rebound typically follows resolution.
Closing Thoughts
Market returns have been positive this year, despite the current challenges. As we move deeper into the year, we believe that the fading pressure from central banks and resiliency from corporations will provide a tailwind for investment portfolio returns. We currently have a balanced view of the economy and financial markets, in which there are a variety of positives and challenges to work through. We aim to manage your portfolio for a wide range of outcomes by utilizing various diversification strategies in our investment approach. Our ongoing focus is to provide advice and recommendations that we believe are well-suited to meet your goals and time horizon.
[1] https://www.cnbc.com/2022/06/01/jamie-dimon-says-brace-yourself-for-an-economic-hurricane-caused-by-the-fed-and-ukraine-war.html
[2] https://www08.wellsfargomedia.com/assets/pdf/about/investor-relations/earnings/first-quarter-2023-earnings.pdf
[3]Emerging Markets Debt is represented by the JPM EMBI Global Diversified Index and JPM GBI-EM Global Diversified Index (50% USD/ 50% Local Currency). The Russell 1000 Index represents U.S. large-cap stocks. The Russell 2000 Index represents U.S. small-cap stocks. International stocks are represented by the MSCI All Country World ex USA Index. The MSCI EM Index represents emerging market equities.
Previous Posts
- Sage Insights: March Madness in the Banking Sector
- Our Perspective: Our Perspective: An Update On The Banking Industry and Interest Rates
- Our Perspective: Current Thoughts on the Banking Industry
- Sage Insights: Strong U.S. Economic Data and the Geopolitical Climate Stall Market Momentum
- Sage 2023 Annual Letter
- Sage 2023 Investment Outlook
Learn More About Sage
Disclosures
The information and statistics contained in this report have been obtained from sources we believe to be reliable but cannot be guaranteed. Any projections, market outlooks, or estimates in this letter are forward-looking statements and are based upon certain assumptions. Other events that were not taken into account may occur and may significantly affect the returns or performance of these investments. Any projections, outlooks, or assumptions should not be construed to be indicative of the actual events which will occur. These projections, market outlooks, or estimates are subject to change without notice. Please remember that past performance may not be indicative of future results. Different types of investments involve varying degrees of risk, and there can be no assurance that the future performance of any specific investment, investment strategy, product, or any non-investment-related content made reference to directly or indirectly in this newsletter will be profitable, equal to any corresponding indicated historical performance level(s), be suitable for your portfolio or individual situation or prove successful. Due to various factors, including changing market conditions and/or applicable laws, the content may no longer be reflective of current opinions or positions. All indexes are unmanaged, and you cannot invest directly in an index. Index returns do not include fees or expenses. Actual client portfolio returns may vary due to the timing of portfolio inception and/or client-imposed restrictions or guidelines. Actual client portfolio returns would be reduced by any applicable investment advisory fees and other expenses incurred in the management of an advisory account. Moreover, you should not assume that any discussion or information contained in this newsletter serves as the receipt of, or as a substitute for, personalized investment advice from Sage Financial Group. To the extent that a reader has any questions regarding the applicability above to his/her situation of any specific issue discussed, he/she is encouraged to consult with the professional advisor of his/her choosing. Sage Financial Group is neither a law firm nor a certified public accounting firm, and no portion of the newsletter content should be construed as legal or accounting advice. A copy of the Sage Financial Group’s current written disclosure statement discussing our advisory services and fees is available for review upon request.