Negotiators from both political parties pushed debt ceiling brinkmanship to the limit yet again. This topic seems to emerge every few years, and this year raised the possibility that the U.S. could default on its outstanding debt. Fortunately, a resolution was agreed upon over the long Memorial Day weekend to raise the U.S. debt limit and avoid this outcome.
In this edition of Insights, we analyze recent market performance, discuss debt ceiling developments, identify the drivers of the U.S. equity market, and emphasize the value of maintaining a longer-term perspective during uncertain periods.
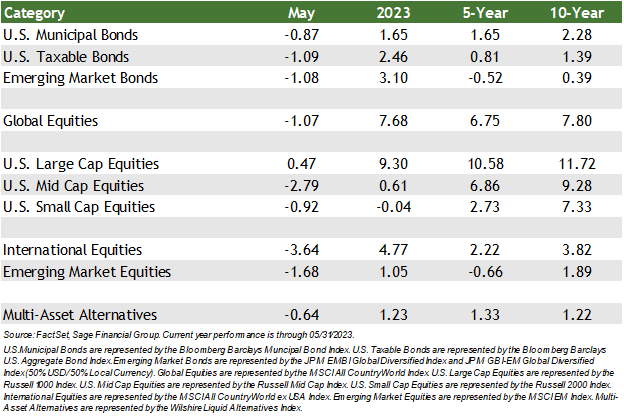
Major asset classes were mostly down in May, largely influenced by ongoing debt ceiling negotiations and increasing uncertainty regarding the economy’s direction.
High-quality bonds declined by 1.09% primarily due to higher interest rates driven by strong economic data, including robust corporate earnings and a resilient U.S. consumer. Despite this modest pullback, the Bloomberg U.S. Aggregate Bond Index is up 2.46% since the beginning of the year. Concurrently, emerging markets debt decreased by 1.08% in May but maintained a year-to-date return of 3.10%.[1]
U.S. large-cap stocks were a bright spot in May, rising by 0.47% as investor sentiment towards technology names strengthened, particularly in the field of Artificial Intelligence. On the other hand, U.S. small-cap stocks performed negatively this past month, falling by 0.92% despite stabilization within regional banks.
International stocks also declined in May. The most widely referenced international stock index fell by 3.64%, and emerging market stocks declined by 1.68%. However, despite the dip in May, international stocks have shown positive performance overall in 2023. Through May, international and emerging market stocks have risen 4.77% and 1.05%, respectively.
Debt Ceiling Resolution: Just in Time
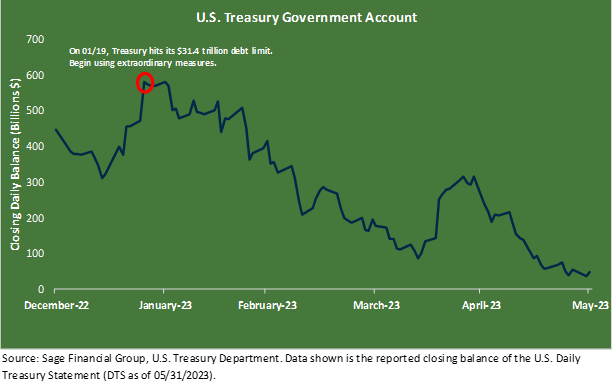
In May, bipartisan congressional discussions took place regarding the best way to suspend the U.S. debt limit. The government reached its borrowing limit in January and began using extraordinary measures to avoid tapping into cash reserves. Without further borrowing, available funds plunged from roughly $600 billion in January to below $50 billion by May’s end. The Treasury considers a cash balance below $30 billion as the “X-date.” Treasury Secretary Janet Yellen underscored to legislators the imminent risk of the U.S. government exhausting both time and funds to meet obligations by early June.
Despite apparent major differences, the negotiations remained constructive, culminating in an agreement over Memorial Day weekend. Once approved in the House of Representatives and Senate, the issuance of treasury securities is expected to replenish the cash balance of the government.
In several Our Perspective posts, we delved into the topic of the U.S. government’s avoidance of default. This coverage began in January when we initially discussed the debt ceiling limit, and again in May with an update on the debt limit deadline. Our confidence was built on the expectation that policymakers had the capacity and awareness to resolve their differences on this singular issue. Similar to this most recent event, previous instances of debt ceiling negotiations also went down to the “11th hour”, causing uncertainty and volatility in financial markets. As the deadline for raising the debt ceiling approached, a growing sense of urgency in Congress provided a strong incentive for all parties involved to avert a self-made crisis.
The Biden administration struck a deal with the Republican majority in the House of Representatives to suspend the debt limit until January 2025. This witnessed both sides relent on some key discrepancies while receiving the desired result in other areas that were a key part of negotiations. Each political party can point towards some victories within the deal, and in a divided government, this is a favorable outcome.
As we shared ahead of the resolution, the Biden administration preferred an increase in the debt limit with no strings attached and had suggested more minor spending cuts over a few years, including defense spending limits in any agreement. The wins for Democrats included:
- No significant modifications to the provisions in the Inflation Reduction Act.
- Entitlement spending, including Social Security and Medicare/Medicaid, was unchanged.
- Removed initial Republican demand for a larger increase in defense spending than the final agreed provision.
House Republicans had pushed for more military spending and deeper cuts to or more restrictions around domestic spending programs. The wins that Republicans could share with their constituents were:
- Military spending increase by 3.3% in 2024 and 1.0% in 2025.
- A reduction of $21 billion allocated to the IRS over the next decade, and a return of $28 billion in unused COVID spending.
- Work requirements for those without dependents to receive food assistance increased from 50 to 54.
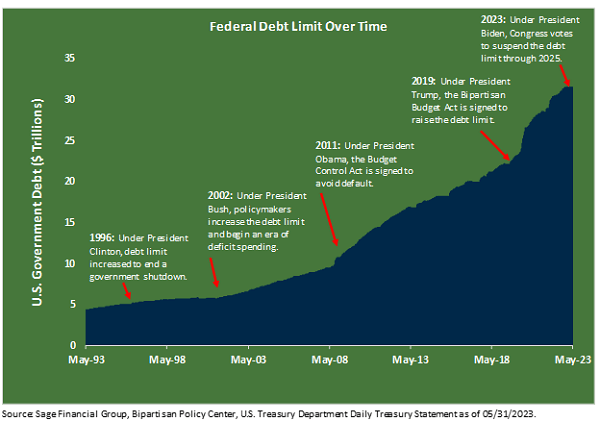
Most importantly, the U.S. has never defaulted on its debt in the 106 years since the debt ceiling was established in 1917. The debt ceiling has been raised 89 times, including 54 instances under Republican presidents and 35 under Democratic presidents.
The present macroeconomic landscape and risks associated with this most recent debt ceiling saga have pressured financial markets. However, while uncertainty remains regarding the economy, the consumer has remained resilient, and there is now more clarity on the debt ceiling.
What is Driving the U.S. Stock Market?
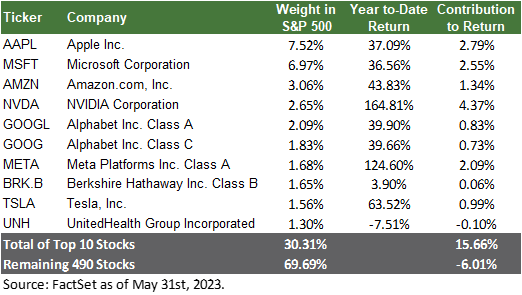
Over the year’s first five months, investors have heavily gravitated towards the largest U.S. consumer-technology stocks, viewing them as defensive investments and driving up their valuations. An interesting dynamic is the influence of Artificial Intelligence (“AI”): 10 companies, primarily those related to AI, have contributed most significantly to the 9.65% year-to-date return for U.S. large-cap stocks. In fact, after excluding these “AI beneficiaries,” U.S. large-cap stocks are down by 6.01%.
Large language models, such as ChatGPT and Artificial Intelligence, more broadly, are transformative technologies. The speed of adoption has been remarkable, with more than 1 million users of ChatGPT within days. From an investment perspective, we observe many of the largest companies in the world continuing to make meaningful investments in the opportunity set.
Sage’s view is that “History Doesn’t Repeat Itself, but It Often Rhymes.” So we have a dual mandate: strategically take advantage of promising new trends while simultaneously avoiding instances when investors chase what was perceived as the “hot” investment of the time.
Many of the biggest AI companies are already included in Sage’s portfolios and are set to benefit from AI’s productivity gains. However, the size of AI’s impact will ultimately depend on its capability and adoption timeline. We want to be mindful and thoughtful about how and when we incorporate AI-favored securities in our investment strategy to avoid any unforeseen risks associated with concentrating exposure in your portfolio.
Staying Invested: Time in the Market versus Timing the Market
During times of volatility, there is a natural inclination to gravitate toward cash holdings. Recently, soaring bond yields and significant uncertainty have contributed to a record amount of cash remaining “on the sidelines,” as evidenced by the $5.2 trillion currently invested in money market funds.
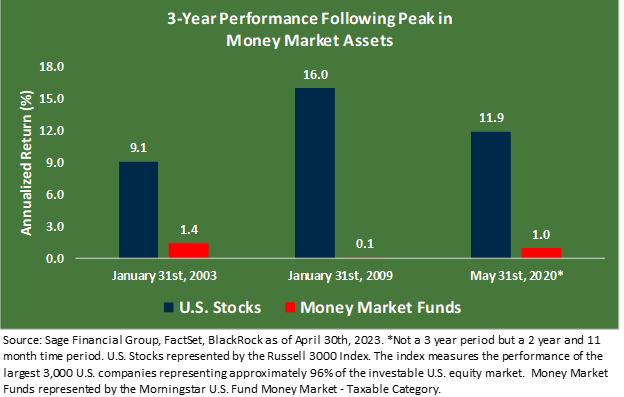
Using history as a guide, U.S. stocks and bonds have traditionally demonstrated strong performance in periods following peaks in money market assets. We believe we are in a similar environment today.
- Over the past thirty years, three distinct periods of money market asset peaks have occurred. These corresponded with significant market events, including the aftermath of the Dot-Com bubble, the Global Financial Crisis, and the initial stages of the COVID-19 pandemic.
- After those three peaks in money market assets, U.S. stocks averaged 12.3% over the subsequent three-year period.
Moving away from the tribulations of 2022, our approach is looking forward to continuing to help achieve your specific investment objective(s).
Thus, our conviction in a portfolio mix of stocks and bonds remains in place to be resilient through varied market conditions. Though investing inherently involves risks, we advocate for preparing portfolios for a wide range of outcomes through diversification.
Closing Thoughts
The angst surrounding a potential U.S. default has us looking forward to the summer months ahead. We expect that markets can put this period of turbulence in the rearview mirror and continue the current momentum over the near and long term.
We remain cautiously optimistic regarding equity markets for the remainder of the year, acknowledging real challenges and potential tailwinds. Our baseline expectation anticipates some pressure on corporate earnings, while higher interest rates have increased the attractiveness of bonds and other income-producing assets. Our focus is with managing our clients’ portfolios is to maximize the probability of meeting their goals over their desired time horizon.
[1]Emerging Markets Debt is represented by the JPM EMBI Global Diversified Index and JPM GBI-EM Global Diversified Index (50% USD/ 50% Local Currency). U.S. large-cap stocks are represented by the Russell 1000 Index. U.S. small-cap stocks are represented by the Russell 2000 Index. International stocks are represented by the MSCI All Country World ex USA Index. Emerging market equities are represented by the MSCI EM Index.
Previous Posts
- Our Perspective: The 2023 Debt Limit
- Sage Insights: Taking Stock of Today’s Climate
- Sage Insights: March Madness in the Banking Sector
- Our Perspective: Our Perspective: An Update On The Banking Industry and Interest Rates
- Our Perspective: Current Thoughts on the Banking Industry
Learn More About Sage
Disclosures
The information and statistics contained in this report have been obtained from sources we believe to be reliable but cannot be guaranteed. Any projections, market outlooks, or estimates in this letter are forward-looking statements and are based upon certain assumptions. Other events that were not taken into account may occur and may significantly affect the returns or performance of these investments. Any projections, outlooks, or assumptions should not be construed to be indicative of the actual events which will occur. These projections, market outlooks, or estimates are subject to change without notice. Please remember that past performance may not be indicative of future results. Different types of investments involve varying degrees of risk, and there can be no assurance that the future performance of any specific investment, investment strategy, product, or any non-investment-related content made reference to directly or indirectly in this newsletter will be profitable, equal to any corresponding indicated historical performance level(s), be suitable for your portfolio or individual situation or prove successful. Due to various factors, including changing market conditions and/or applicable laws, the content may no longer be reflective of current opinions or positions. All indexes are unmanaged, and you cannot invest directly in an index. Index returns do not include fees or expenses. Actual client portfolio returns may vary due to the timing of portfolio inception and/or client-imposed restrictions or guidelines. Actual client portfolio returns would be reduced by any applicable investment advisory fees and other expenses incurred in the management of an advisory account. Moreover, you should not assume that any discussion or information contained in this newsletter serves as the receipt of, or as a substitute for, personalized investment advice from Sage Financial Group. To the extent that a reader has any questions regarding the applicability above to his/her situation of any specific issue discussed, he/she is encouraged to consult with the professional advisor of his/her choosing. Sage Financial Group is neither a law firm nor a certified public accounting firm, and no portion of the newsletter content should be construed as legal or accounting advice. A copy of the Sage Financial Group’s current written disclosure statement discussing our advisory services and fees is available for review upon request.