Heading into the year, most economists forecast that the labor market would need to weaken for inflation to fall, pushing the economy into a recession. Yet, as we sit here today, inflation is heading in the right direction, albeit slowly, and the unemployment rate is just above 50-year lows. At the same time, this economic resilience has pushed U.S. Treasury yields to levels last witnessed before the Global Financial Crisis.
In this edition of Insights, we explore recent market performance, discuss the continued economic resiliency of the U.S. consumer, and share a historical perspective on how a government shutdown might have impacted investors.
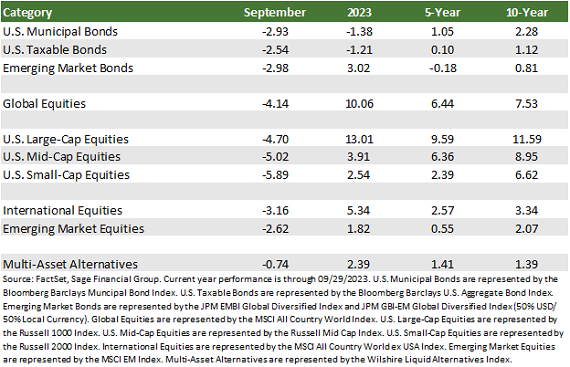
Major market indices declined broadly in September, concluding what was a challenging third quarter for most investors. As we expressed last month, decisions by many global central banks, including the Federal Reserve, European Central Bank, and the Bank of England, to hold interest rates at elevated levels has put pressure on stocks and bonds.
Bond markets responded to the Fed’s reaffirmation that it intends to keep interest rates higher for longer by pushing the yield on the 10-year Treasury note above 4.60%, a 16-year high. They also did not like that the Fed left the door open for future hikes at the September Federal Open Markets Committee (FOMC) meeting. As a result, high-quality bonds fell by 2.54% in September, causing year-to-date performance for the category to fall slightly negative despite higher yields.[1]
In several emerging markets, central banks continue to diverge from the developed world by pausing rate hikes or, in the case of select South American countries, cutting rates. As a result, rising U.S. Treasury yields placed upward pressure on the U.S. dollar relative to local currencies and contributed to a decline of 2.98% in September for emerging markets debt.
Meanwhile, equity markets could not shake the “September effect.” U.S. large-cap equities experienced their most significant single-month decline of the year. The Russell 1000 Index fell by 4.70% as the handful of mega-cap technology stocks that have led a market movement to the upside this year relinquished some gains. Per CFRA Research, September is the worst month on average for U.S. large-cap equities since 1945.[2]
Small-cap equities offered no reprieve as investors expected the impact of higher interest rates to weigh on the financial health of smaller companies. The 5.89% monthly decline for small caps and underperformance relative to large caps appears to be deeply tied to the effect of tighter monetary policy.
International equities also finished the month in negative territory, with the most widely referenced index falling by 3.16% and emerging markets equities declining by 2.62%. In the middle of the month, European policymakers signaled that economic conditions across much of that region had weakened. Europe seems to be entering a soft economic patch that we expect will persist in the coming quarters.
Bond Yields Continue Their Upward Ascent
Persistently strong economic data and elevated inflation have primarily influenced the Fed’s path to decelerate the economy and increase interest rates over the last eighteen months.
Economic growth continues to point to an economy that can withstand the historic pace of monetary policy tightening.
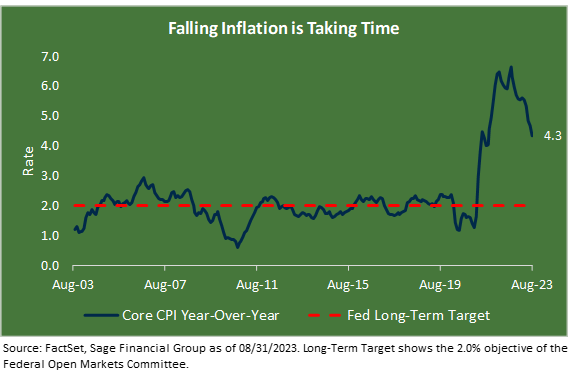
Nonetheless, inflation remains above the Fed’s 2% long-term target. In August, inflation, as measured by core CPI, increased by 4.3% year-over-year. This is below the 4.7% reading in July 2023 and off the peak of 6.6% from September 2022. Disinflationary pressures continue to be shown in the form of reduced consumer spending, tightening of lending from banks, and elevated borrowing costs.
In Fed Chairman Powell’s prepared statement following the September FOMC meeting, he shared, “We have raised our policy interest rate by 5-1/4 percentage points and have continued to reduce our securities holdings at a brisk pace. We have covered a lot of ground, and the full effects of our tightening have yet to be felt.” Essentially, he is saying that the Fed has raised rates significantly, while committee members now see less need to cut rates significantly in 2024.
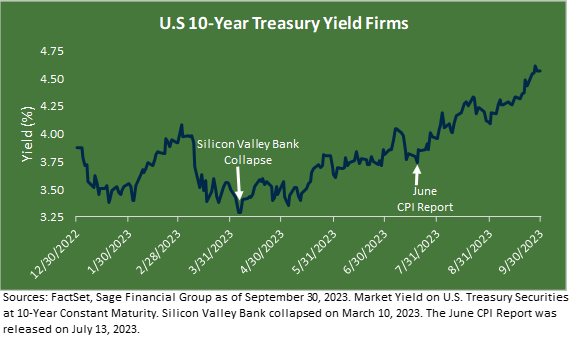
This year has provided no shortage of market disruption, culminating in mid-March when a handful of U.S. financial institutions collapsed, most notably Silicon Valley Bank. At that point, the bond market began to become increasingly concerned about the financial health of the U.S. economy as yields fell quickly and an expectation grew that the Fed would be forced to step in and stimulate the economy sooner than anticipated.
This all changed by the middle of the summer when the yield on the U.S. 10-year note rose above 4.60% for the first time since 2007. Yields pushed higher as the June CPI report shed some light on the Fed’s need to rein in inflation at the July meeting. Since then, yields have roared higher by more than half a percentage point.
In our view, much of the recent upward pressure on yields has been centered around investors digesting the Summary of Economic Projections (SEP), which were released following the most recent Fed meeting. The key takeaways included GDP growth forecasts revised up to 2.1% and 1.5% for 2023 and 2024. Unemployment is expected to hang around 4% over the same period.
Finally, committee members kept the door open for one more rate hike in 2023, should economic conditions evolve as expected. Importantly, we would caveat this view as policymakers’ average or middle expectation. Much remains to unfold over the course of the coming year, and committee members’ views vary widely.
For example, high-quality bonds currently offer a yield-to-maturity of around 5.5%, among the most attractive forward returns for these types of bonds seen in over a decade. Sage has been modestly adding to high-quality bond exposure in client portfolios for which it makes sense, recognizing as well that these bonds tend to perform well during periods of equity volatility.
While high rates are generating volatility, historically, bond returns have been positive on average in the 1-, 3-, and 5-year periods after a rate-hike cycle concludes. While the Fed may keep rates higher for longer than previously expected, we believe that the Fed Funds rate is sufficiently restrictive and that future hikes will likely be limited.
Consumer Health Check-In
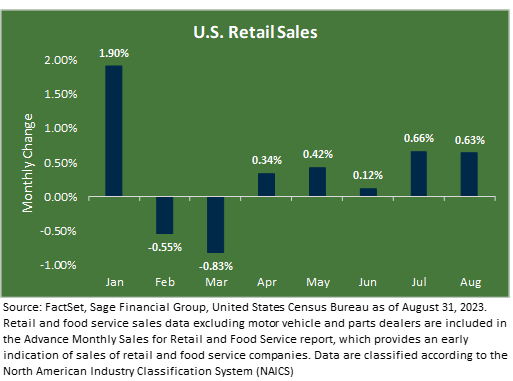
U.S. retail sales expanded by 0.63% last month, marking the fifth consecutive monthly increase.
Consumer spending, which accounts for over 68% of U.S. GDP, is driving persistent and more robust than widely expected economic growth, impacting the Fed’s continued tight monetary policy, thereby pressuring bond prices and equity valuations.
Despite rising real wages, we are closely following the health of the labor market and the fading of excess savings of consumers. A study from the San Francisco Federal Reserve[3] shows that U.S. households accumulated $2.1 trillion of excess savings from March 2020 through August 2021. Since then, $1.9 trillion has been drawn down to navigate higher prices.
Consumer behavior this year has surprised many forecasters who had expected that consumers would rein in initially enthusiastic spending when faced with higher borrowing costs and dwindling savings that had accumulated during COVID-driven stimulus funding (alongside restricted buying options caused by pandemic-related supply chain disruptions). This resiliency has led to a more aggressive Federal Reserve. Upcoming holiday spending figures should be a helpful indicator of the health of the underlying economy, specifically the U.S. consumer.
A key objective of diversification is to prepare for a variety of outcomes in the economy and markets, such as, in this case, a surprisingly strong consumer and doggedly persistent Federal Reserve. While stocks and bonds have struggled in recent months, the positive performance of some less traditional strategies in Sage’s portfolios, such as multi-asset alternatives, private real estate, and floating rate loans, has provided some balance.
Government Narrowly Avoids a Shutdown
Another unsettling factor is that the U.S. government narrowly avoided a shutdown after members of both political parties in the House of Representatives agreed on the scope and size of an annual spending bill at the 11th hour.
If the government had shut down, federal agencies and all non-essential and discretionary roles would not have functioned until new funding legislation was passed.
While ominous sounding, the near government shutdown was not expected to impact investors as much as might be feared. In fact, U.S. large-cap stocks rose during each of the past six shutdowns that lasted longer than a day.
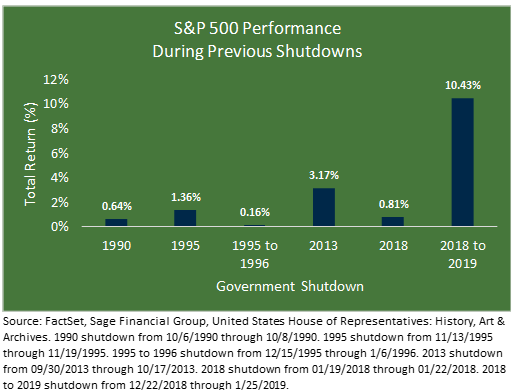
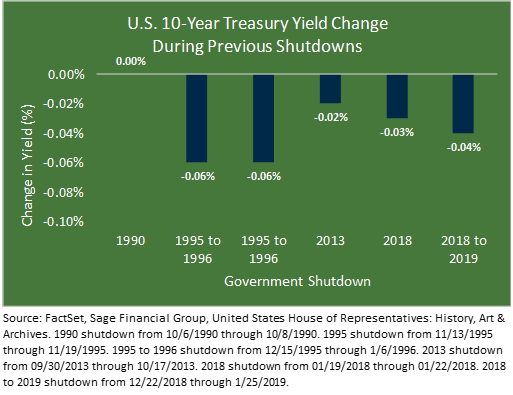
There are several observations worth noting in these recent shutdowns. In each, U.S. equity markets were either flat or rose from the beginning to the end of the shutdown. 2018 is most pronounced as it marked the conclusion of a Federal Reserve rate hiking cycle. At the same time, the 10-year Treasury yield has shown little to modest declines during each shutdown.
However, we want to be cautious about forming conclusions about the market’s reaction to a potential shutdown. Historically, these shutdowns have occurred during other events, creating an idiosyncratic relationship.
Acknowledging that six such government shutdowns over thirty years present a limited sample size we nevertheless believed heading into the final stretch of negotiations that the impact of a shutdown on markets would be considerably more muted than the effect of the debt ceiling brinkmanship that played out earlier this year.
A key important feature will be the availability of government-related economic data, which the Federal Reserve relies on to make informed decisions. It would have become problematic if private data collection was used as a substitute for the monthly jobs and CPI print. In turn, this no longer throws a potential wrinkle in the November FOMC policy decision.
Our current view is that the potential implications around the near shutdown should be short-lived, and making any changes to our clients’ portfolios unnecessary and possibly counterproductive. Ultimately, the American voter will decide who is to blame for the ongoing government tumult.
Closing Thoughts
It is not lost on us that this past month and quarter may have been unsettling. With that being said, we believe we have carefully constructed our clients’ diversified portfolio to weather short-term market downturns while enabling them to participate when markets rise.
Of course, we will continue to analyze incoming data on monetary policy, consumer health, and the U.S. government’s state so that we can adjust portfolios accordingly and in a timely manner to meet our clients’ specific objectives and needs if necessary and appropriate.
While the current environment is challenging, we continue to believe that the performance of stocks and bonds will meet our expected and targeted returns that are built into our modeling for investment portfolio and financial plans and goals.
[1]Emerging markets debt is represented by the JPM EMBI Global Diversified Index and JPM GBI-EM Global Diversified Index (50% USD/ 50% Local Currency). U.S. large-cap stocks are represented by the Russell 1000 Index. U.S. small-cap stocks are represented by the Russell 2000 Index. International stocks are represented by the MSCI All Country World ex USA Index. Emerging market equities are represented by the MSCI EM Index.
[2] https://www.morningstar.com/news/marketwatch/20230902307/a-stormy-september-for-us-stocks-may-lie-ahead-what-investors-need-to-know-about-wall-streets-worst-month
[3] https://www.frbsf.org/our-district/about/sf-fed-blog/excess-no-more-dwindling-pandemic-savings/
Previous Posts
- Sage Recognized By Leading Financial Journals
- Sage Insights: Market Observations At Summer Ends
- Sage Insights: A Mid-Summer Look at Markets, Inflation, & Earnings Season
- Sage Insights: Getting Back on Track in 2023
- Sage Insights: Take It To The Limit
- Our Perspective: The 2023 Debt Limit
Learn More About Sage
Disclosures
The information and statistics contained in this report have been obtained from sources we believe to be reliable but cannot be guaranteed. Any projections, market outlooks, or estimates in this letter are forward-looking statements and are based upon certain assumptions. Other events that were not taken into account may occur and may significantly affect the returns or performance of these investments. Any projections, outlooks, or assumptions should not be construed to be indicative of the actual events which will occur. These projections, market outlooks, or estimates are subject to change without notice. Please remember that past performance may not be indicative of future results. Different types of investments involve varying degrees of risk, and there can be no assurance that the future performance of any specific investment, investment strategy, product, or any non-investment-related content made reference to directly or indirectly in this newsletter will be profitable, equal to any corresponding indicated historical performance level(s), be suitable for your portfolio or individual situation or prove successful. Due to various factors, including changing market conditions and/or applicable laws, the content may no longer be reflective of current opinions or positions. All indexes are unmanaged, and you cannot invest directly in an index. Index returns do not include fees or expenses. Actual client portfolio returns may vary due to the timing of portfolio inception and/or client-imposed restrictions or guidelines. Actual client portfolio returns would be reduced by any applicable investment advisory fees and other expenses incurred in the management of an advisory account. Moreover, you should not assume that any discussion or information contained in this newsletter serves as the receipt of, or as a substitute for, personalized investment advice from Sage Financial Group. To the extent that a reader has any questions regarding the applicability above to his/her situation or any specific issue discussed, he/she is encouraged to consult with the professional advisor of his/her choosing. Sage Financial Group is neither a law firm nor a certified public accounting firm, and no portion of the newsletter content should be construed as legal or accounting advice. A copy of the Sage Financial Group’s current written disclosure statement discussing our advisory services and fees is available for review upon request.