Most major asset classes posted positive returns during the year’s first seven months, and investors enjoyed a respite. This momentum eased, however, in August as higher interest rates prompted concerns about the economy’s health.
In this edition of Insights, we take a closer look at recent market performance and discuss the concerns in the market, the driving forces behind higher interest rates and bond yields, and what to make of China’s underwhelming re-opening after the COVID pandemic.
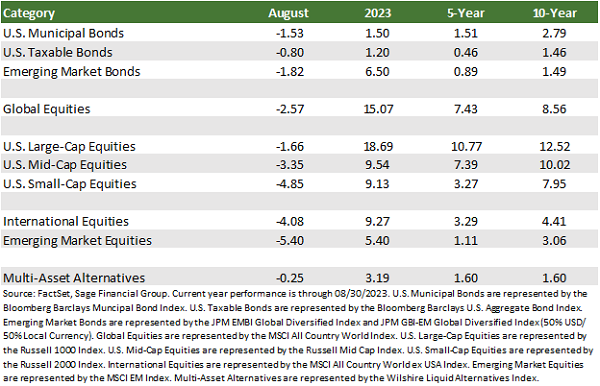
Nearly all major market indices returned some of their annual gains in August. While the quarterly earnings season was better than anticipated, higher yields placed pressure on stocks and bonds globally.
High-quality bonds declined 0.80% in August, and interest rates rose throughout the month. Central banks in several emerging markets began to diverge from the developed world by pausing rate hikes or, in the case of Brazil, cutting rates. However, their accommodative monetary policy was not supportive enough alone to prevent emerging markets debt from falling by 1.82% in August. [1] The strength of the U.S. dollar is another complicated force that weighed on the returns of debt denominated in foreign currencies.
U.S. large-cap stocks continued to benefit the most from current enthusiasm around artificial intelligence (AI), but they still declined by 1.66%. Their small-cap counterparts contracted even more sharply and shed 4.85%. Near the end of August, global chipmaker Nvidia’s robust earnings and sales projections surpassed analyst expectations, highlighting a growing corporate push to integrate AI into daily life.
International equities also declined in August, with the most widely referenced international stock index falling by 4.08% and emerging market stocks dropping by 5.40%. So far in 2023, much of the weakness from international companies can be attributed to China, where the ruling party’s notable fiscal restraint has deflated the earlier optimism about economic rejuvenation post-COVID.
Rising Bond Yields, but Declining Inflation?
In 2022, bond yields rose at an unprecedented speed. The Fed was in the middle of the fastest period of monetary policy tightening in nearly forty years. Countless comparisons were made to the late 1970s and early 1980s as investors sought to retool their playbook.
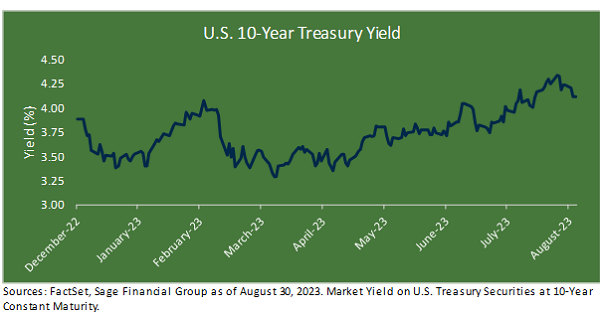
In 2023, while the Fed has slowed its rate hiking campaign, the precise end date remains unclear. We believe this lack of clarity is driving higher bond yields.
Many factors drive interest rates, but at a high level, are primarily dictated by inflation and economic growth expectations.
When market participants are more uncertain about the future, they expect higher yields to compensate for unforeseen events. The U.S. economy has been more resilient than expected in 2023, which has led many market participants to expect the Fed Funds rate to remain higher for longer.
Uncertainty about how rate policy may evolve is what we believe has contributed to U.S. Treasury yields rising throughout the summer, rather than a resurgence of higher inflation expectations.
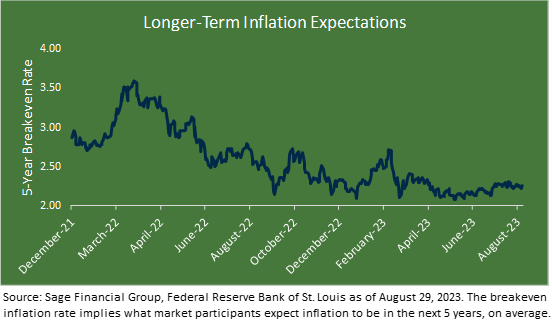
Inflation expectations becoming unanchored or rising beyond the control of policymakers had been a key reason behind the Fed embarking on the hiking of interest rates. At the recent annual Jackson Hole meeting, Fed Chairman Jerome Powell reaffirmed the Fed’s commitment to getting inflation back down to 2%, on average. Powell and the rest of the Federal Open Markets Committee want to achieve this targeted 2% goal without sending the economy into an economic contraction.
As shown below, inflation expectations have remained firmly anchored. The two most recent Consumer Price Index (CPI) readings have shown soft readings, with the core index up at an annualized rate of only 1.9% across June and July. Two months of cooling inflation is not a meaningful sample to change Fed policy but should be enough to keep rates on hold until later this year.
Growth has been resilient, with incoming economic data exhibiting continued strength. Data points like employment, income, and industrial production indicated a strengthening economy and surpassed expectations, driving higher yields.
Yet, leading economic indicators that have historically predicted changes in business cycles continued to suggest an economic slowdown ahead. This slowing in economic activity was observed through consumer expectations of future business conditions and a reduction in new order activity.
The Fed does not know if the continued strength in the economic data is due to less restrictive policy or if the impact of higher rates will require more time to take effect. To lean on the side of caution, the Fed will continue to monitor incoming data thoroughly before taking next steps with policy (taking rates either higher or lower).
Taking a step back, we observe annual real economic growth from the U.S. over the last twenty years. For an average calendar year, the economy has increased by just over 2% since 2003, and excluding 2009 and 2020, growth was positive in every other year. Yet, estimates for the next three years suggest growth will likely remain below the long-term trend.
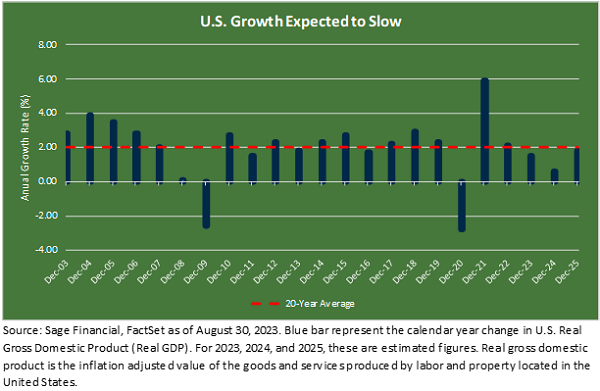
More resilient growth expectations have led to higher interest rates from a market perspective. Higher interest rates have weighed directly on bond returns since the beginning of 2022. Like the economy, stocks have been more resilient in 2023, but we expect higher rates to weigh more on economic activity and corporate profits over the next year.
In our portfolios, toggling portfolio exposure between reducing interest rate sensitivity and adding to longer-maturity bonds has been a careful balancing act over the last two years. Beginning in June of 2021, we recommended that investors reduce their exposure to interest-rate sensitive fixed rate bonds, which proved prudent and reduced losses in 2022.
After yields became more attractive about a year ago, we reversed course and added to bonds as our confidence increased that higher interest rates would have a delayed impact on the economy, thus leading to a peak in interest rates. Many high-quality bond funds offer yields of 5.5% or more while offering the potential for appreciation during equity volatility.
Sage’s approach is to plan for a wide range of future expected outcomes, one in which yields remain elevated, thus providing income-oriented, diversified investors with a cushion should periods of equity volatility emerge.
China Struggles to Get Back on Track
Another factor affecting the markets in July was China. As the world’s second-largest economy, its policies and performance have a global impact, and its restrictive economic policies concerning COVID and corporate profits have hindered its financial markets.
Late last year, we began to get early indications that China’s COVID policy might ease as Beijing ended some of the most restrictive policies worldwide and loosened a crackdown on technology companies. At the time, our base case was for the relaxation of these policies to contribute to a sharp rebound for the Chinese economy and translate to strong investment returns.
To our surprise, the government has not sufficiently supported the recovery of the Chinese economy or targeted critical areas of the market, leaving investors disappointed.
Most recently, in mid-August, the People’s Bank of China (PBOC) lowered the rate used for commercial lending from 3.55% to 3.45%, below the long-term average of 3.82% (see below). This decision suggested policymakers are seeking to stimulate the economy. However, underneath the surface is a large debt load in China, particularly in the real estate sector.
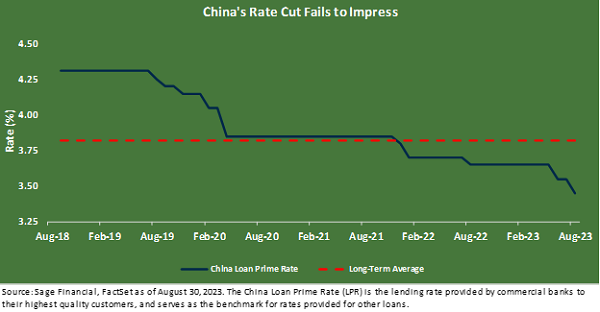
We believe China’s growth will be a key driver of global market performance over the next few years. Our current expectation is for the larger Chinese banks to cut rates first to spur consumer spending and positively impact sentiment. We believe it would be positive for global stocks and bonds if government officials in Beijing directly targeted incremental policy measures to bolster the economy rather than going “all-in” at once.
We are cautiously optimistic that government spending and targeted measures at de-risking the property sector can create dynamics that should be a tailwind boosting the economy and stocks, which we saw from November 2022 to January 2023 when MSCI China rallied more than 52%. Key catalysts for performance rebound, in our view, include:
- Monetary stimulus (near-term): The cutting of interest rates by the People’s Bank of China to address sluggish growth and a currency tailwind spurred by Chinese goods becoming more affordable to foreign buyers, driving up Chinese exports.
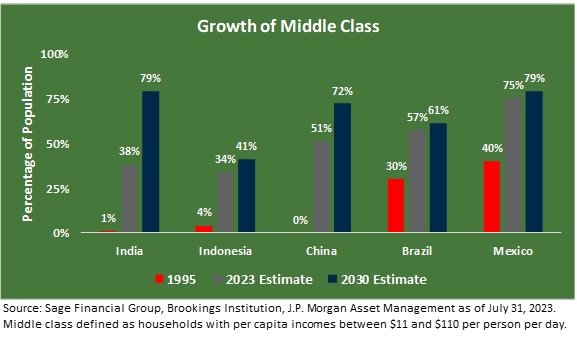
- Secular growth of middle class (medium-term): Over the next seven years, the middle class is expected to grow by 21%, which increases the propensity to consume goods/services. A great segment of the total population from the middle class is expected to contribute to higher GDP per capita, which should drive overall economic and market growth.
While the outlook on China can be gloomy at times, particularly in their property sector, there are still potential catalysts such as more government stimulus, improvement in consumer sentiment, and secular tailwinds.
We believe that geographic diversification allows our clients to participate in overall global growth while reducing risk factors associated with the underperformance of specific countries or regions.
Our positioning today is neutral on international stocks, and in the interest of caution, we are allocating to strategies that have reduced direct exposure to Chinese equities.
Closing Thoughts
As summer ends, we are particularly focused on preparing portfolios for the possibility of higher interest rates and its impact on the economy. This can slow business activity in general while creating more attractive bond yields for investors.
We are carefully analyzing incoming information and data to gain a clear understanding of the Federal Reserve’s monetary direction and the ever-changing global economic landscape. By leveraging our research, we aim to address variables that might affect your portfolio. This corresponds with our primary objective of designing a diversified portfolio aligned with our clients’ financial goals and timeframe. While there are ongoing challenges, we remain cautiously optimistic about the returns of stocks and bonds in the coming years and tailor their portfolios to their specific needs.
[1] Emerging markets debt is represented by the JPM EMBI Global Diversified Index and JPM GBI-EM Global Diversified Index (50% USD/ 50% Local Currency). U.S. large-cap stocks are represented by the Russell 1000 Index. U.S. small-cap stocks are represented by the Russell 2000 Index. International stocks are represented by the MSCI All Country World ex USA Index. Emerging market equities are represented by the MSCI EM Index.
Previous Posts
- Sage Insights: A Mid-Summer Look at Markets, Inflation, & Earnings Season
- Sage Insights: Getting Back on Track in 2023
- Sage Insights: Take It To The Limit
- Our Perspective: The 2023 Debt Limit
Learn More About Sage
Disclosures
The information and statistics contained in this report have been obtained from sources we believe to be reliable but cannot be guaranteed. Any projections, market outlooks, or estimates in this letter are forward-looking statements and are based upon certain assumptions. Other events that were not taken into account may occur and may significantly affect the returns or performance of these investments. Any projections, outlooks, or assumptions should not be construed to be indicative of the actual events which will occur. These projections, market outlooks, or estimates are subject to change without notice. Please remember that past performance may not be indicative of future results. Different types of investments involve varying degrees of risk, and there can be no assurance that the future performance of any specific investment, investment strategy, product, or any non-investment-related content made reference to directly or indirectly in this newsletter will be profitable, equal to any corresponding indicated historical performance level(s), be suitable for your portfolio or individual situation or prove successful. Due to various factors, including changing market conditions and/or applicable laws, the content may no longer be reflective of current opinions or positions. All indexes are unmanaged, and you cannot invest directly in an index. Index returns do not include fees or expenses. Actual client portfolio returns may vary due to the timing of portfolio inception and/or client-imposed restrictions or guidelines. Actual client portfolio returns would be reduced by any applicable investment advisory fees and other expenses incurred in the management of an advisory account. Moreover, you should not assume that any discussion or information contained in this newsletter serves as the receipt of, or as a substitute for, personalized investment advice from Sage Financial Group. To the extent that a reader has any questions regarding the applicability above to his/her situation or any specific issue discussed, he/she is encouraged to consult with the professional advisor of his/her choosing. Sage Financial Group is neither a law firm nor a certified public accounting firm, and no portion of the newsletter content should be construed as legal or accounting advice. A copy of the Sage Financial Group’s current written disclosure statement discussing our advisory services and fees is available for review upon request.