Financial markets started 2023 on a positive note as stocks and bonds both saw gains in January. It was a welcomed change as many investors hope to put 2022 firmly in the rearview mirror. As shared in our annual outlook, we forecast that 2023 will be a year of more normalized market conditions, albeit against a harsher economic backdrop.
Globally, equities and bonds have pushed higher for several reasons: equities are forward-looking, and several negative factors have improved, at least temporarily, from last year. Specifically, the geopolitical environment was somewhat less noisy, and inflation has shown early signs of stabilizing as constraints on supply chains have eased.
At the same time, bond yields fell throughout the month amid indications that the Federal Reserve is approaching the end of its unprecedented monetary policy tightening campaign, which boosted most major asset classes. Fed officials met for two days on January 31st and February 1st to assess the impact of restrictive monetary policy on the broader economy to restore price stability through continued lower levels of inflation.
While potentially resilient corporate earnings and fading pressure from central banks are expected to be tailwinds for financial markets in 2023, we believe that caution is still warranted in the near term. The economy continues to offer mixed signals in certain segments, including a housing market slowdown and broad layoffs by technology companies. Sage’s approach has always been to monitor developments like these and build portfolios designed for various outcomes with a focus on helping our clients achieve their goals.
In this edition of Insights, we recap recent market performance, discuss the easing of inflationary pressures and interest rates, and share some insights about recent developments involving the U.S. Federal Debt limit.
Performance Recap
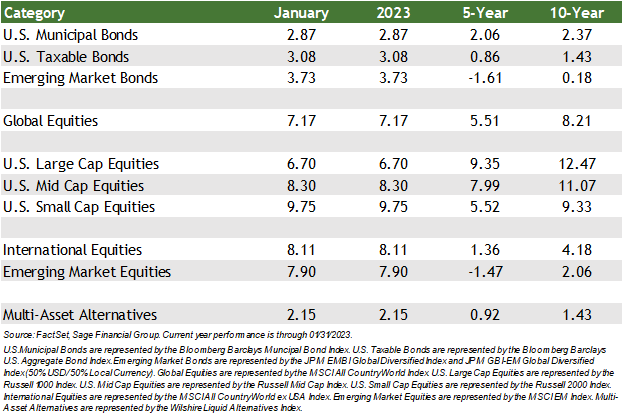
A rise in stock and bond prices provided a promising start to the new year. In addition, market participants found a reprieve in core inflation that ran at 3.1% annualized in the fourth quarter of 2023, marking the lowest quarterly reading in 15 months. A prolonged cooling of inflation could signify to investors that global monetary policy is leaning in a dovish direction. In January:
- High-quality bonds rose 3.08%[1], their second-strongest month since December 2008, as investors grew optimistic that the Fed will decrease the magnitude of interest rate hikes from now on and potentially lower rates later in 2023.
- Equity markets in the U.S. and abroad exhibited similar strength in January. Lower yields remained a positive for stocks globally, and, though still in the early innings, corporate earnings reports have been broadly in line with analysts’ expectations. As a result, in January, global equities (the combination of U.S. and international equities) rose by 7.17%, U.S. large-cap stocks increased by 6.70%, and the most widely quoted international stock index increased by 8.11%.
- Over the past 10 years, global equities have returned 8.21% annually, on average. However, it is extremely rare for the market to realize that specific return in any given year. Instead, returns can vary widely from year to year, as evidenced by the 15% drop experienced in 2022 that stood in stark contrast to the returns from 2019-2021 of 26.60%, 16.25%, and 18.54%, respectively, which averaged more than 20%.
Central Banks Slow Hikes
One of the key questions our investment team is asking this year is, “How will global central banks respond to the direction of inflation data, and what will that mean for investors?”
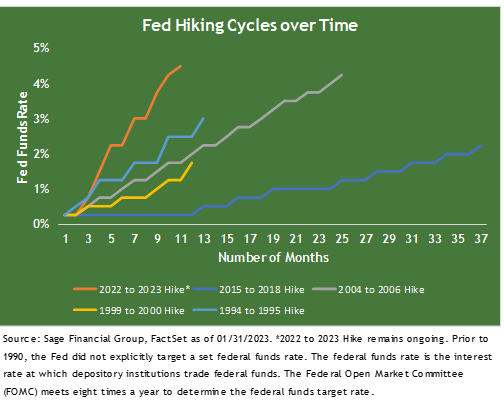
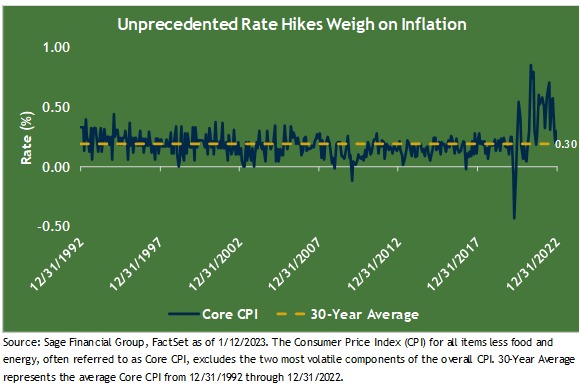
Last year, financial markets suffered as the Federal Reserve aggressively fought to restore price stability and lower inflation within the U.S. This unprecedented cycle of rate hikes is having the intended effect on prices, and Fed Chair Powell recently stated that the Fed has been encouraged by initial signs of disinflation. As mentioned above, investors are hopeful that the world’s largest central bank will begin to slow hikes and potentially lower rates later in the year.
While it is still early in 2023, this is good news for asset prices and investors. The monthly reading on Core Consumer Price Index (CPI) has returned to pre-March 2020 levels (note: Core CPI excludes volatile food/energy). This has been a welcome sight after a year in which these monthly readings eclipsed 0.5% per month.
Another result of last year’s aggressive rate hikes is the inverted yield curve, which has boosted high-quality bonds and is typically a sign that the economy may slow in the future. This dynamic is complex from an equity perspective because stocks typically bottom prior to the economy hitting a trough. Risks remain to “something breaking” following the aggressive central bank tightening campaigns, which could mean higher unemployment, defaults, or other adverse scenarios.
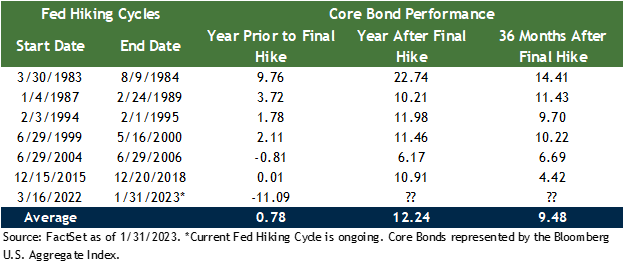
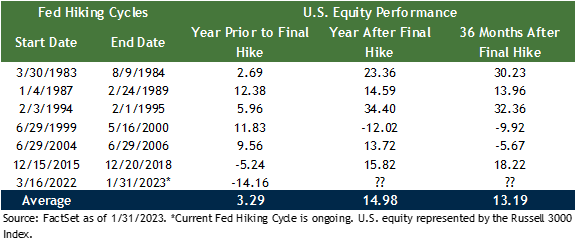
We balance these various scenarios by constructing portfolios designed for various environments. Following Fed rate hiking cycles, from a historical perspective, core bonds tend to perform quite well (see chart below). Since 1980, core bonds have returned, on average, 0.78% in the year before the end of a Fed rate hiking cycle. However, being patient did pay off. In the 12 and 36 months following a rate hiking cycle, core bonds returned an average of 12.24% and 9.48%, respectively.
As a result, we believe there is an opportunity for appropriate portfolios to benefit from having longer-maturity bonds as a part of a diversified fixed-income allocation. Moreover, as yields have risen, bonds now offer attractive income and diversification benefits should equity volatility persist.
Corporate America Kicks Off Earnings Season
Corporate America kicked off earnings season in mid-January. This follows a year in which inflation and central bankers were center stage for each quarter. We believe it is important and refreshing to see market participants focus more on earnings fundamentals at the beginning of 2023.
The low bar set for this earnings season could be helpful if companies exceed expectations and provide optimistic outlooks. Some companies, particularly those in technology and other cyclical industries, have already recorded higher profits due to their efforts to control costs. For example, Facebook and Instagram owner Meta Platforms rose more than 20% after reporting strong revenues and a renewed focus on costs and expenses, primarily through reduced hiring.
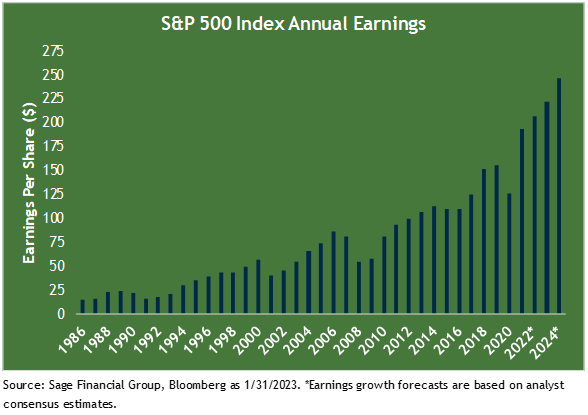
So far, corporations have been mixed in what they have announced. Per FactSet’s latest Earnings Insight report as of January 27, the blended quarterly earnings growth rate for Q4 S&P 500 EPS stands at -5.0%, less than the -3.2% expected at the end of the quarter. For the full year, analysts expect a modest earnings rise in 2022 (see chart below).
Risks certainly remain in terms of macroeconomic headwinds and unknown risks, but our analysis leads us to remain cautiously optimistic. However, because of the “low bar,” the market has been rewarding positive surprises more than usual and even rewarding negative surprises by 0.7%, on average. This is a great example of skepticism helping stocks, as many investors found the reports “better than feared.”
Based on commentary from company management so far this season, corporate America seems to be increasingly anticipating a soft landing rather than a more pronounced slowdown/recession. However, if the current rate environment holds, this most recent quarter may be the trough in some interest rate-sensitive industries, such as housing. For example, homebuilder PHM’s commentary cited that the housing market has stabilized in mid-Q4 and even improved so far in January in response to the rate pullback.
Resilient profits would be a welcome sight for both equity and bond investors. Profit margins may be at least somewhat maintained through layoffs, and a softer labor market would create less of a headwind for the Fed. Most major asset classes could be helped if corporations can manage through the slowdown and the Fed slows down its aggressive pace. In the case of equities, while U.S. stocks historically only rose 3.29% during the final year of a Fed rate hiking cycle, the average 12- and 36-month subsequent performance has been 14.98% and 13.19%, respectively.
Long-term Perspectives on the Debt Ceiling
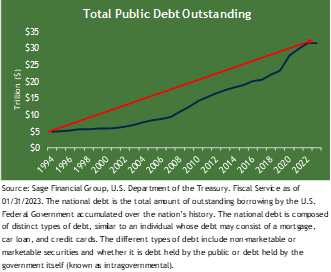
Treasury Secretary Janet Yellen sent a letter to Congress on January 13th informing members that the U.S. would hit its current $31.4 trillion debt limit on January 19th.
Sure enough, the U.S. hit the limit on that date and is now employing “extraordinary measures to avoid a default over the next few months. These measures include suspending contributions to some government pension plans and halting new investments within the health plans of retired postal workers. Alongside these measures, Congress is expected to work to pass legislation that would raise the limit. Since 1960, Congress has acted 78 times to adjust the debt limit, most recently in July 2021. Extraordinary measures were introduced in 1985 and have been used 6 times between 2011 and 2021.
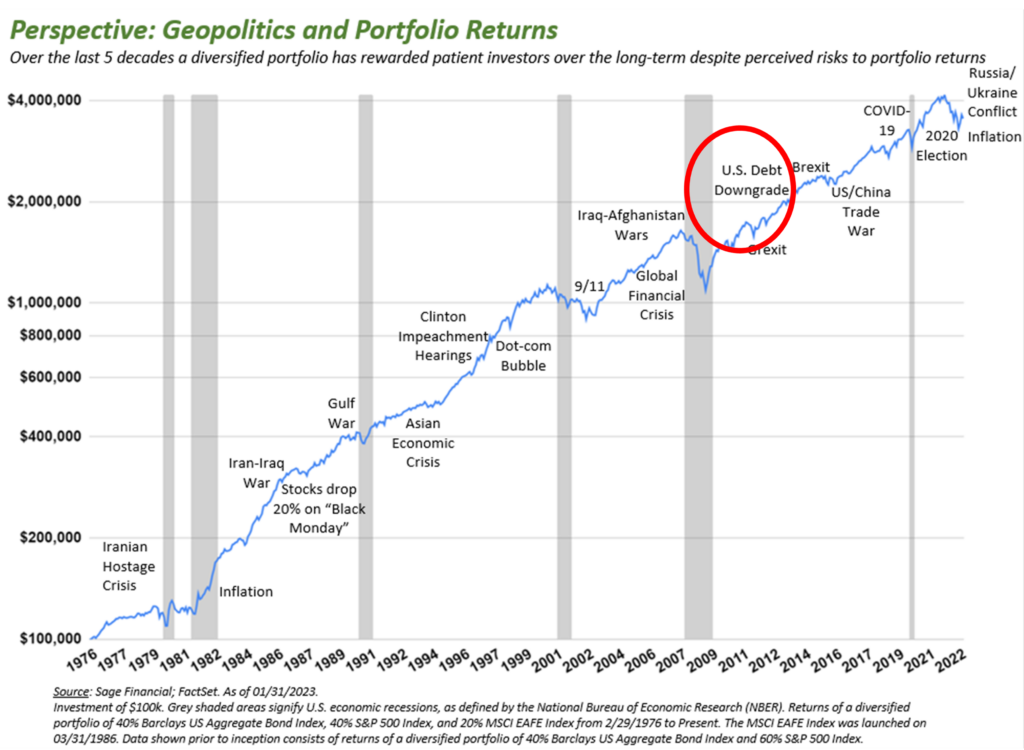
In each prior instance of debt ceiling upheaval, members of Congress found common ground. In 2011 S&P downgraded the U.S. national debt by one notch from its highest rating, stating, “More broadly, the downgrade reflects our view that the effectiveness, stability, and predictability of American policymaking and political institutions have weakened at a time of ongoing fiscal and economic challenges.”
As we shared in January, we cannot be sure how this latest debate about the debt ceiling will play out, but so far, we are not alarmed.
In the past, however, both sides were motivated to get a deal done. Each time this issue has occurred over the last century, both political parties blamed each other to strengthen favorability ahead of upcoming elections. There is the potential risk for the U.S. to default on its debt, even if for a short period, which would likely lead to a loss of trust in the financial system. Our base case, however, remains that Congress will find a resolution around the limit, albeit that may not occur until the summer months, and a solution may occur much closer to the expiration date.
At the moment, it may feel unsettling as the uncertainty regarding the debt ceiling has caused temporary market volatility and garnered significant attention from the media. However, both of these outcomes were expected, and Sage seeks to build portfolios designed to remain resilient through various market conditions, including today’s environment.
Closing Thoughts
The strong start to 2023 leaves us cautiously optimistic about 2023, even though we expect volatility to remain a factor going forward.
We believe inflationary pressures will continue to show signs of easing, with rising interest rates likely nearing completion. As we move deeper into the year, the fading pressure from central banks and resiliency from corporations should provide a tailwind for investment portfolio returns. We also believe that the more reasonable valuations today could point to returns in the future in line with our financial planning assumptions.
We will remain focused on using our research and knowledge about the forces that may impact clients’ portfolios to help you achieve your goals.
[1] U.S. Large Cap stocks are represented by Russell 1000 Index, Global Equities by MSCI All Country World Index, International Equities by the MSCI All Country World Ex-USA Index, Emerging Market Stocks by the MSCI Emerging Markets Index, and U.S. Investment Grade Bonds by the Bloomberg Barclay’s U.S. Aggregate Index. Performance as of 1/31/2023.
Previous Posts
- Our Perspective: The Debt Ceiling
- Sage 2023 Annual Letter
- Sage 2023 Investment Outlook
- Sage Insights: Markets Bounce as Economic Growth Slows and China Adjusts Its COVID Policy
- Sage Insights: Federal Reserve Rate Hikes Persist, Political Volatility in China, and Perspective on the Journey of Investing
Learn More About Sage
The information and statistics contained in this report have been obtained from sources we believe to be reliable but cannot be guaranteed. Any projections, market outlooks, or estimates in this letter are forward-looking statements based on certain assumptions. Other events that were not taken into account may occur and may significantly affect the returns or performance of these investments. Any projections, outlooks, or assumptions should not be construed to be indicative of the actual events which will occur. These projections, market outlooks, or estimates are subject to change without notice. Please remember that past performance may not be indicative of future results. Different types of investments involve varying degrees of risk. There can be no assurance that the future performance of any specific investment, investment strategy, product, or any non-investment-related content made reference to directly or indirectly in this newsletter will be profitable, equal to any corresponding indicated historical performance level(s), be suitable for your portfolio or individual situation or prove successful. Due to various factors, including changing market conditions and/or applicable laws, the content may no longer be reflective of current opinions or positions. All indexes are unmanaged, and you cannot invest directly in an index. Index returns do not include fees or expenses. Actual client portfolio returns may vary due to the timing of portfolio inception and/or client-imposed restrictions or guidelines. Actual client portfolio returns would be reduced by any applicable investment advisory fees and other expenses incurred in managing an advisory account. Moreover, you should not assume that any discussion or information contained in this newsletter serves as the receipt of, or as a substitute for, personalized investment advice from Sage Financial Group. To the extent that a reader has any questions regarding the applicability above to his/her individual situation or any specific issue discussed, he/she is encouraged to consult with the professional advisor of his/her choosing. Sage Financial Group is neither a law firm nor a certified public accounting firm, and no portion of the newsletter content should be construed as legal or accounting advice. A copy of the Sage Financial Group’s current written disclosure statement discussing our advisory services and fees is available for review upon request.
Sage Financial Group has a long track record of citations and accolades. Rankings and/or recognition by unaffiliated rating services and/or publications should not be construed by a client or prospective client as a guarantee that s/he will experience a certain level of results if Sage is engaged, or continues to be engaged, to provide investment advisory services. Nor should it be construed as a current or past endorsement of Sage by any of its clients. Rankings published by magazines and others generally base their selections exclusively on information prepared and/or submitted by the recognized advisor. For more specific information about any of these rankings, please visit Our Accolades page or contact us directly.
© 2023 Sage Financial Group. Reproduction without permission is not permitted.