In November, financial markets recovered some of the ground lost during the previous ten months. This was the second straight month of positive returns for equities, which is encouraging in a year with no shortage of challenges. At the same time, bond returns had their strongest single month of 2022 in November. As we look at the markets in December and beyond, we continue to remain cautiously optimistic.
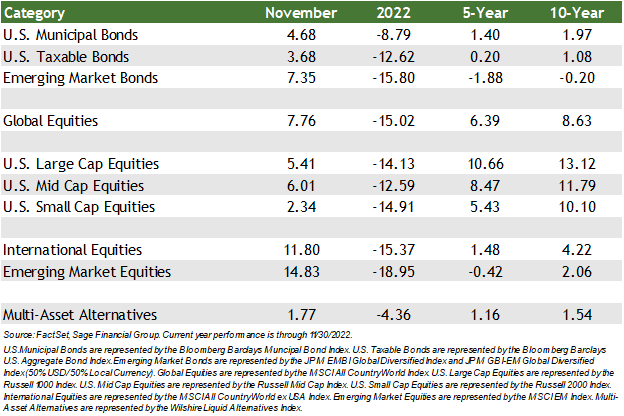
There’s no denying that bond returns have been historically bad in 2022. The upside is that the rapid decline of bond prices has occurred at a significant pace and provides buyers with a cheaper price and meaningfully higher income than the paltry levels seen at the beginning of the year. Still, 2022 remains the largest calendar-year decline in U.S. bonds over the last 100 years, down 12.62% through November 30.
The state of the market today is a reminder that no investor should attempt to forecast future events with high precision. Instead, Sage’s approach has always been to build portfolios designed for a range of outcomes with a focus on helping our clients achieve their goals over the long term.
In this edition of Insights, we recap recent market performance, discuss slowing economic growth and its implications, and examine the impact of China’s recent COVID policy decisions.
Performance Recap
Like most analysts, our team has been focused on the effect of inflation on the economy and the ripple effects of higher prices in financial markets. The most recent monthly inflation figures came in lower than expected, providing some modest sense of relief.
- High-quality bonds had their best month of the year in November. A growing belief that the Fed will decrease the magnitude of interest rate hikes going forward likely contributed to the 3.68% monthly return for investment-grade bonds. [1]
- Equity markets in the U.S. and abroad moved higher in November. Lower yields were also good for stocks, and international stocks performed very well. Global equities (the combination of U.S. and international equities) rose by 7.76%, U.S. large-cap stocks increased by 5.41%, and the most widely quoted international stock index increased by 11.80%.
- Global equities have returned, on average, 8.63% annually over the past 10 years. While 8-9% returns may be “average,” it is extremely rare for the market to realize that return in any given year. Instead, wider returns are more common. While this year’s decline (-15.02% year-to-date through November) stands in stark contrast to the yearly gains of more than 20% in 2019, 2020, and 2021, these return ranges are not unusual.
Markets Bounce as Economic Growth Slows
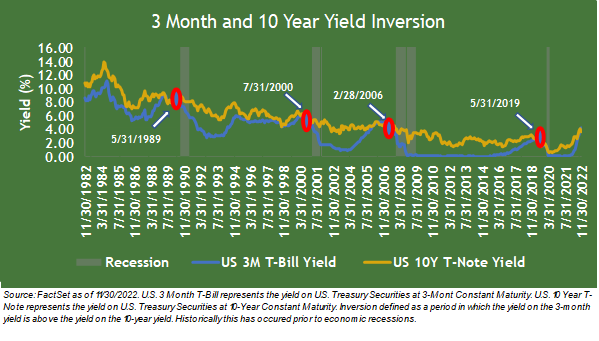
The U.S. Treasury yield curve provides insights into the economy. For example, when the economy is healthy and expected to grow in the future, the interest rates of U.S. Treasuries are “upward sloping,” and 10-year bonds have a higher rate than their 3-month counterparts. In November, the yield curve inverted as the rate on the 3-month Treasury Bill surpassed that of the 10-Year Treasury Note. This is the first inversion since early 2020 and typically indicates that investors are anticipating slower economic growth.
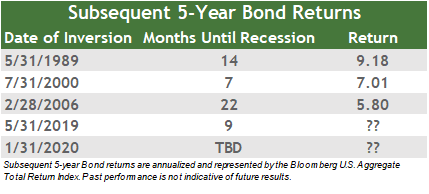
During each of the four most recent economic recessions, the 3-month yield and 10-year yield inverted ahead of the economic slowdown. However, while the inversion has been a reliable predictor of a future recession, the period between the inversion and the recession has varied tremendously.
It’s important to note that in each of these recessions, bonds provided investors with mid- to high-single-digit annualized returns over the subsequent five years. So once again, that old adage remains true — time in the market proves to be more valuable than trying to time the market.
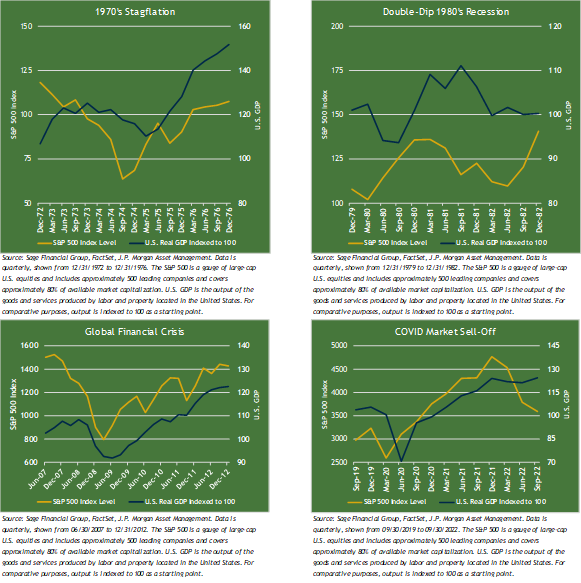
Equity markets are forward-looking; they typically bottom before the economy rebounds. In contrast, GDP and many other economic indicators are backward-looking. The charts below show this dynamic at work over the last 50 years. While geopolitical headwinds, inflation, and tighter financial conditions have weighed on the current economy, we believe that equity markets will bottom before an economic slowdown hits its lowest point. Over the four periods shown, the S&P 500 index hit a low before the economy, as measured by GDP, followed suit.
Right now, our reading of the economy shows continued tailwinds and headwinds. Nevertheless, we continue to believe in a global multi-asset class portfolio approach with an eye toward changes or moderate adjustments when appropriate to mitigate portfolio volatility.
Since the beginning of 2021, we have looked to further diversify portfolios in anticipation of a challenging environment for traditional asset classes. These changes included adding numerous nontraditional funds, including alternative bonds, infrastructure, and real estate in anticipation of an economic slowdown and the possibility of recession. We also reduced client exposure to more interest rate-sensitive equity funds, where possible.
China’s More Dynamic COVID Policy Boosts International Stocks
Throughout 2022, China has marched to the beat of its own drum in terms of political and economic agendas. The world’s second-largest economy has moved in a “stop and go fashion” as the government provides strict but ever-changing guidance about containing the spread of COVID throughout the country.
Previously the Chinese government had implemented a “zero-COVID’ approach that tolerated a tradeoff for slower economic growth at the cost of slowing viral transmission.
Current messaging from government officials suggest an economic re-opening across the country is underway. The government has introduced a plan with 20 key parameters, including testing and quarantining, to help ease away from its restrictive policy.
The perception of this shift to a more dynamic strategy boosted international equities in November. As new daily cases rose across the country, equity market performance increased. In November, the MSCI China Index rose by approximately 25% but remains down by roughly 30% since the beginning of the year.
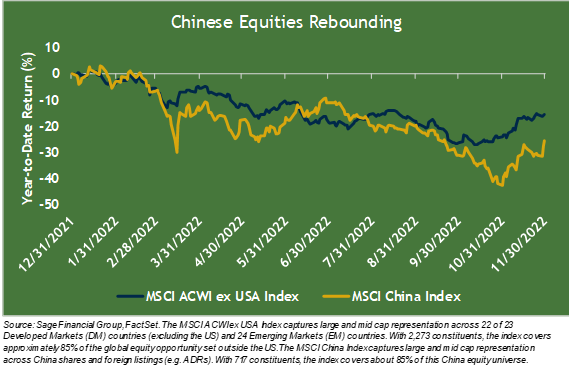
From a market perspective, international stocks benefit the most from this shift in China’s policy. According to Eurostat, the total trade value between China and Europe was $732 billion in 2021. Chinese buyers are Europe’s third largest trade partner and represent nearly 10% of total export activity.
This is not one-sided, as European buyers import nearly 22% of Chinese goods. Primary trade between the partners includes machinery, vehicles, and chemicals. A clarified political strategy from governments such as China could bring certainty into the global economy, which markets tend to favor. We saw this in the nearly 12% gains for international stocks in November, while emerging market stocks rose by nearly 15%.
Sage continues to believe geographical diversification should benefit portfolios over time with better risk management and a higher probability of returns.
Closing Thoughts
The markets’ positive performance in November was encouraging as 2022 mostly provided investors with a significant intra-year decline for equity markets and questioned the protective nature of fixed income in portfolios.
We are also cautiously optimistic as a strong reset in market valuations has created investment opportunities within the economic uncertainty that lies ahead. Therefore, we will continue to approach market developments with thought and care while focusing on your personal circumstances and short and long-term financial goals.
[1] U.S. Large Cap stocks represented by Russell 1000 Index, Global Equities by MSCI All Country World Index, International Equities by the MSCI All Country World Ex-USA Index, Emerging Market Stocks by the MSCI Emerging Markets Index, and U.S. Investment Grade Bonds by the Bloomberg Barclay’s U.S. Aggregate Index. Performance as of 11/30/2022.
Previous Posts
Sage Insights: Technical Recession, Economic Data versus Equity Markets, and A Broader Perspective
Sage Recognized for Commitment to Clients
Learn More About Sage
The information and statistics contained in this report have been obtained from sources we believe to be reliable but cannot be guaranteed. Any projections, market outlooks, or estimates in this letter are forward-looking statements and are based upon certain assumptions. Other events that were not taken into account may occur and may significantly affect the returns or performance of these investments. Any projections, outlooks, or assumptions should not be construed to be indicative of the actual events which will occur. These projections, market outlooks, or estimates are subject to change without notice. Please remember that past performance may not be indicative of future results. Different types of investments involve varying degrees of risk, and there can be no assurance that the future performance of any specific investment, investment strategy, product or any non-investment-related content, made reference to directly or indirectly in this newsletter will be profitable, equal to any corresponding indicated historical performance level(s), be suitable for your portfolio or individual situation or prove successful. Due to various factors, including changing market conditions and/or applicable laws, the content may no longer be reflective of current opinions or positions. All indexes are unmanaged and you cannot invest directly in an index. Index returns do not include fees or expenses. Actual client portfolio returns may vary due to the timing of portfolio inception and/or client-imposed restrictions or guidelines. Actual client portfolio returns would be reduced by any applicable investment advisory fees and other expenses incurred in the management of an advisory account. Moreover, you should not assume that any discussion or information contained in this newsletter serves as the receipt of, or as a substitute for, personalized investment advice from Sage Financial Group. To the extent that a reader has any questions regarding the applicability above to his/her individual situation of any specific issue discussed, he/she is encouraged to consult with the professional advisor of his/her choosing. Sage Financial Group is neither a law firm nor a certified public accounting firm and no portion of the newsletter content should be construed as legal or accounting advice. A copy of the Sage Financial Group’s current written disclosure statement discussing our advisory services and fees is available for review upon request.
Sage Financial Group has a long track record of citations and accolades. Rankings and/or recognition by unaffiliated rating services and/or publications should not be construed by a client or prospective client as a guarantee that s/he will experience a certain level of results if Sage is engaged, or continues to be engaged, to provide investment advisory services. Nor should it be construed as a current or past endorsement of Sage by any of its clients. Rankings published by magazines and others generally base their selections exclusively on information prepared and/or submitted by the recognized advisor. For more specific information about any of these rankings, please click here or contact us directly.