Stocks and bonds both performed well in July, providing a moment of positivity in what has been a challenging environment for the global economy and financial markets. Still, markets have remained volatile, which we know can create stress. We feel it too.
While markets had an encouraging July, the headwinds they have faced for much of the year came back into focus last week when the U.S. Bureau of Economic Analysis (BEA) reported a second consecutive quarter of negative real GDP growth in Q2, which is defined as a “Technical Recession.”
As Media outlets and prognosticators are likely to make headlines out of this topic over the coming days and weeks, we want to provide some balanced context regarding what’s happening in the global economy and what we believe it means for your portfolio and personal financial goals.
In this edition of Insights, we recap this fast-changing market environment, share our thoughts on the recent economic data, discuss the economy versus equity markets, and provide a broader perspective.
Performance Recap: Volatility Remains High
Uncertainty regarding the Federal Reserve’s policy has remained high. The Fed hiked interest rates by 0.75 percentage points last week, which was the second hike of that size this year, aiming to put downward pressure on inflation. Fixed income markets expected only 0.50 percentage points of Fed policy rate hikes in all of 2022 as recently as November 2021, but investors now expect rate hikes to total 3.0-3.5 percentage points this year.
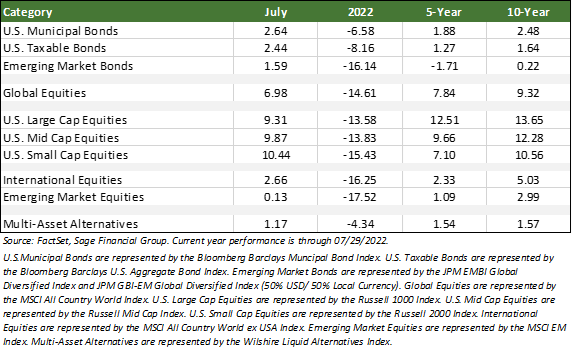
- Equity markets performed well in July, led by U.S. small-cap equities, which returned 10.44%. U.S. large-cap stocks followed, advancing by 9.31%. Global equities gained 6.98%. The most widely quoted international stock index rose 2.66%, and emerging market stocks were up by 0.13%.[1]
- Still, global equities have dropped by 15.5% on average year-to-date through July 29th, following average yearly gains of over 20% in 2019, 2020, and 2021.
- The dramatic change in Federal Reserve policy expectations has contributed to higher rates and, unfortunately, sharply lower bond prices. Investment Grade Bonds have fallen by 7.5% this year, and U.S. High Yield Bonds have fallen by 10%. In contrast, many alternative investments have “only” declined 2%-4%.
Technical Recession, But A More Balanced Outlook
The market’s positive performance in July came as the U.S. Bureau of Economic Analysis (BEA) reported that the U.S. Economy, after considering higher prices, shrank 0.9% on an annualized basis in Q2 2022. The BEA’s inflation calculation was 8.7% in the quarter, which means it estimates the total economy grew at 7.8% on a “nominal” basis.
Two negative quarters of real GDP are defined as a “technical recession,” which will raise speculation that the U.S. economy is in a recession. However, this rule of thumb is not how the National Bureau of Economic Research (NBER) defines a recession. The NBER defines a recession as a “significant decline in economic activity that is spread across the economy and lasts more than a few months. In our interpretation of this definition, we treat the three criteria—depth, diffusion, and duration—as somewhat interchangeable.”
What we have seen so far is that economic data points have positive and negatives:
- Positives: Banks remain exceptionally well-capitalized following the Global Financial Crisis and have built up even more capital since COVID began, which can help cushion economic softness. While economic momentum is certainly slowing, it is hard to call it a recession when businesses are adding jobs quickly (e.g., 3 million jobs have been added year-to-date).
- Negatives: Inflation remains high, with recent readings showing 40-year high inflation of ~9%. The low consumer confidence readings reflect the pain consumers are feeling. Also, technology companies, and those exposed to mortgages or cryptocurrency, have been slowing hiring or engaging in layoffs.
From an investment perspective, it is beneficial to remember that equities do not always decline significantly during a recession. Most market indices are already down 13-18% this year, which we think creates an attractive risk/reward situation over an investable time horizon. Below is a table showing U.S. large-cap stock returns in the context of every recession since WWII, including the 6 months leading up to the recession, during the actual recession itself, and then one, three, five years, and ten years from the end of the recession:
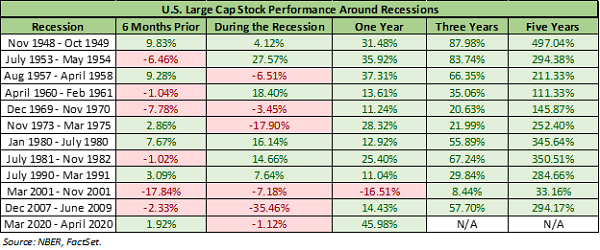
In our view, uncertainty regarding Fed policy, cost pressures, and inventories remain a pain point for equity and bond prices. However, equity prices have already seen significant declines and may be “pricing in” (i.e., already anticipating) a slowdown or mild recession. In past recessionary periods, equities have typically performed exceptionally well after the economic recession ends, which can be hard to pinpoint. We think this underscores the importance of staying invested during times like these. Sage has added strategies in many portfolios that we think can perform well across various outcomes, such as alternatives and flexible bond funds.
Economic Data Versus Equity Markets
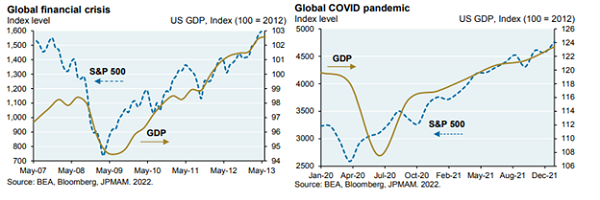
As we have written in the past, because equity markets are forward-looking, they typically bottom before the economy rebounds. In contrast, GDP and many other economic indicators are backward-looking. We saw this dynamic in both the Global Financial Crisis and the COVID pandemic. While inflation is hurting the economy, we expect markets to bottom before the slowdown hits its lowest point.
For example, if the Federal Reserve were to slow down its rate hikes, equity markets could be relieved far before government economic statistics begin to rebound. The same could be true if the Russia/Ukraine war becomes more of a perpetual situation, with some allowances for food and commodity exports (i.e., less pressure on commodity prices would be helpful for markets).
This dichotomy requires patience from investors. Despite the headlines, we believe that “balanced” is the best way to describe the current economic environment. Right now, there are both potential catalysts and real problems in the economy. Yet we continue to have conviction in a global multi-asset class portfolio and will make changes or moderate adjustments when appropriate to reduce exposure to Europe or add less economically sensitive asset classes such as infrastructure.
A Broader Perspective
Investor reactions to current events primarily drive short-term swings, but over more extended periods, the economy’s growth and profitability of companies generally drive equity returns.
Despite sharp short-term fluctuations in stock markets, U.S. large-cap stocks[2] have returned 10% per annum since 1926.
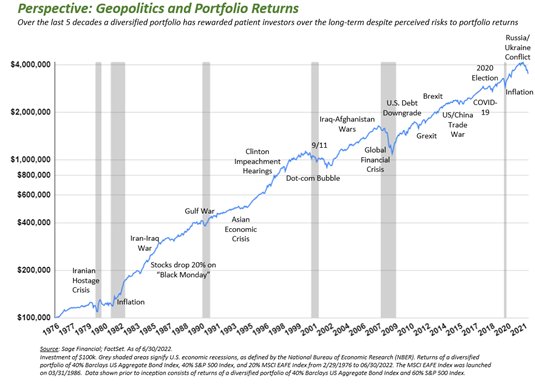
Historically, large-cap equity corrections of 10% or more happen every 1-2 years, bear markets of 20% declines happen every 3-5 years, and recessions occur every 5-10 years.
Over the past 45 years, we have experienced a number of corrections, bear markets, and recessions (not to mention wars, crises, and other events). Despite this volatility, when we zoom out like in the below chart, portfolio returns have followed a relatively steady path higher.
In times like these, it is helpful to reflect more broadly on why we invest. During periods of volatility, uncertainty regarding what the world will look like in a month, quarter, or year, can cause fluctuations in prices, the corporate profits that impact stock and bond investors, and the psychology of market participants.
But foundationally, stock markets go up over time because of growth in economic output (Nominal Gross Domestic Product, or “GDP”), which is driven by the combination of real GDP (population growth and technological innovation) and inflation. Corporate profits essentially take a stable, but fluctuating, piece of that economic output, which drives stock prices higher over time.
Closing Thoughts
While July offered some reprieve, we acknowledge that 2022 has not been easy for investors. Uncertainty remains high regarding the economy and geopolitical events, and this has impacted investor and consumer sentiment.
Despite those challenges, Sage maintains a balanced outlook on the economy and the financial markets. We’re confident in our planning and the tools we have in place to guide our clients through periods of volatility. This is not the first bout of volatility we’ve navigated. And while we’re committing our full focus and resources to potential negative developments, we’re not losing sight of opportunities, either.
As we wrote last month, there have been only three other periods in history in which the S&P 500 declined by 20% or more in the year’s first half. Although there is no guarantee that history will repeat itself, in each of those three periods (1932, 1962, and 1970), the index provided a positive return in the second half of the year.
We will continue to rely on the investment principles that have anchored Sage since its founding in 1989. Our focus is on crafting portfolios that are well-diversified, structured to reduce volatility over time, and informed by our understanding of your financial goals, risk tolerance, time horizon, and return objectives.
If you have any questions about the topics covered in this month’s commentary or wish to discuss any aspect of your goals or future, please do not hesitate to contact your Sage advisor or us directly.
[1] U.S. Large Cap stocks are represented by Russell 1000 Index, Global Equities by MSCI All Country World Index, International Equities by the MSCI All Country World Ex-USA Index, Emerging Market Stocks by the MSCI Emerging Markets Index, and U.S. Investment Grade Bonds by the Bloomberg Barclay’s U.S. Aggregate Index.
[2] The S&P index returns start in 1926 when the index was first composed of 90 companies. The name of the index at that time was the Composite Index or S&P 90. In 1957 the index expanded to include the 500 components we now have today. The returns include both price returns and re-invested dividends.
Previous Posts
Sage Insights: Ongoing Inflation, China’s Evolving COVID Policy, and Geopolitics in Europe
Our Perspective on Continued Market Volatility
Our Perspective on the Current Market Environment
Sage Insights: Geopolitics, Earnings, and Investing Principles
Sage Recognized for Commitment to Clients
Learn More About Sage
The information and statistics contained in this report have been obtained from sources we believe to be reliable but cannot be guaranteed. Any projections, market outlooks, or estimates in this letter are forward-looking statements and are based upon certain assumptions. Other events that were not taken into account may occur and may significantly affect the returns or performance of these investments. Any projections, outlooks, or assumptions should not be construed to be indicative of the actual events which will occur. These projections, market outlooks, or estimates are subject to change without notice. Please remember that past performance may not be indicative of future results. Different types of investments involve varying degrees of risk, and there can be no assurance that the future performance of any specific investment, investment strategy, product or any non-investment-related content, made reference to directly or indirectly in this newsletter will be profitable, equal to any corresponding indicated historical performance level(s), be suitable for your portfolio or individual situation or prove successful. Due to various factors, including changing market conditions and/or applicable laws, the content may no longer be reflective of current opinions or positions. All indexes are unmanaged and you cannot invest directly in an index. Index returns do not include fees or expenses. Actual client portfolio returns may vary due to the timing of portfolio inception and/or client-imposed restrictions or guidelines. Actual client portfolio returns would be reduced by any applicable investment advisory fees and other expenses incurred in the management of an advisory account. Moreover, you should not assume that any discussion or information contained in this newsletter serves as the receipt of, or as a substitute for, personalized investment advice from Sage Financial Group. To the extent that a reader has any questions regarding the applicability above to his/her individual situation of any specific issue discussed, he/she is encouraged to consult with the professional advisor of his/her choosing. Sage Financial Group is neither a law firm nor a certified public accounting firm and no portion of the newsletter content should be construed as legal or accounting advice. A copy of the Sage Financial Group’s current written disclosure statement discussing our advisory services and fees is available for review upon request.
Sage Financial Group has a long track record of citations and accolades. Rankings and/or recognition by unaffiliated rating services and/or publications should not be construed by a client or prospective client as a guarantee that s/he will experience a certain level of results if Sage is engaged, or continues to be engaged, to provide investment advisory services. Nor should it be construed as a current or past endorsement of Sage by any of its clients. Rankings published by magazines and others generally base their selections exclusively on information prepared and/or submitted by the recognized advisor. For more specific information about any of these rankings, please click here or contact us directly.