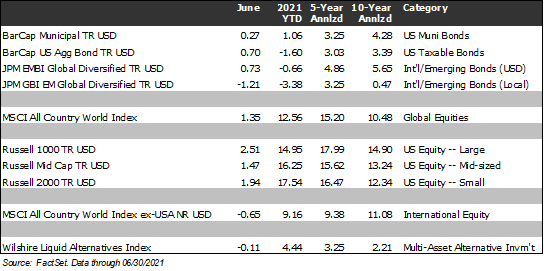
The equity markets performed well in June, supported by continued positive developments throughout the global economy. Equities have performed exceptionally well through the first half of the year, while bonds have been mixed. The MSCI ACWI Index, which represents global equities (i.e., both U.S. and international stocks), advanced by 12.56% in the first half of the year, the U.S. large-cap Russell 1000 Index rose 14.95%, the U.S. small-cap Russell 2000 Index increased by 17.54%, and the MSCI ACWI Ex-USA Index (international stocks) gained by 9.16%. Core U.S. taxable bonds represented by the Bloomberg Barclays Aggregate U.S. Bond Index ended the first half of the year down 1.60%, primarily due to modestly lower interest rates. Municipal bonds fared better, posting a gain of 1.06% in the first 6 months of 2021.
In this edition of Insights, we reflect on the first half of the year and revisit the six major themes we identified in our 2021 Outlook (January) as likely to have the most impact on 2021: (1) Accommodative Monetary and Fiscal Policy, (2) The Vaccine Rollout, (3) Consumer Spending Driven by Pent-up Demand, (4) The Acceleration of Secular Trends, (5) Inflation, and (6) A New Political Regime in the U.S.
Accommodative Monetary and Fiscal Policy
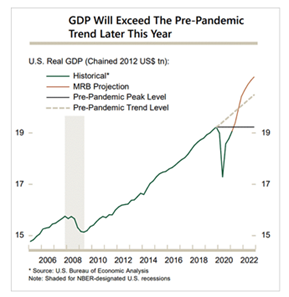
In our 2021 Outlook, we noted that “stimulus remains the most important thing to watch in terms of short-term market activity and the long-term possibility of returning to pre-COVID GDP levels.” It is hard to overstate the importance of monetary and fiscal policy on the economy and stock market. We think that fiscal has remained a strong tailwind. As shown below, the U.S. economy is set to return to pre-COVID levels of output, as measured by Gross Domestic Product, after Q2 2021. Further, at the current trajectory, we expect that economic output will surpass the pre-COVID trend by either Q3 or Q4 of this year.
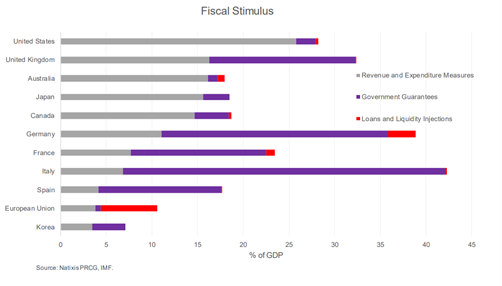
Such a rebound would not have been possible without significant fiscal and monetary stimulus. Fiscal spending exceeded any effort in the post-WWII era, and it is still ongoing. As shown below, the U.S. has spent nearly 30% of GDP on direct payments to consumers and businesses, government guarantees, and loans. Other countries around the world have taken similar measures, although to varying degrees. The overall result has somewhat limited permanent economic damage.
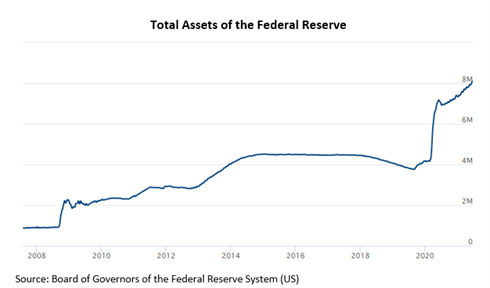
In addition, monetary policy has been accommodative. While the Federal Reserve (Fed) has become modestly more watchful of its easy policy, the Fed is currently not expected to raise rates from the current mark of 0% in either 2021 or the first half of 2022. The current program of $120 billion/month of asset purchases is likely to continue throughout 2021 (i.e., the Fed’s balance sheet should continue to grow into mid-2022).
Government spending and central bank actions have truly been unprecedented. Some analysts and financial media outlets think that creating new money via bond purchases could create inflation. Although no one knows for sure, including us, many of the same concerns were floated between 2009-2014, when quantitative easing was first implemented in earnest. Inflation never took off in the U.S. or in other countries where central banks were expanding balance sheets, including Europe and Japan. Then as now, the opposite problem of disinflation may be more of a concern. From a financial market perspective, the continued growth of the Fed’s balance sheet and zero interest rate policy (ZIRP) remain positive.
Vaccine Rollout
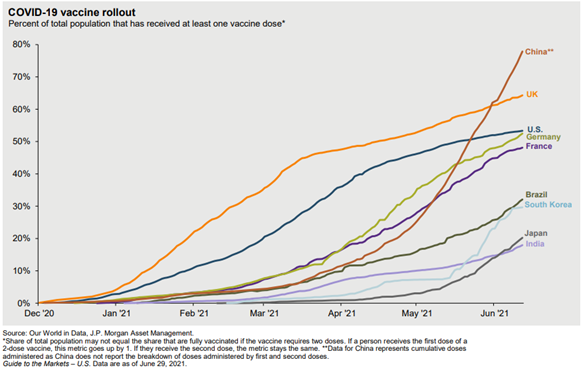
At the beginning of 2021, the U.S. and most of the developed world had only recently provided emergency use authorization for the Pfizer/BioNTech and Moderna vaccines. Thus, the rollout of this breakthrough scientific technology was in its early stages, with several logistical headwinds to navigate. But as the winter months passed, nearly all adults in the U.S. were given a choice to receive a vaccine. Moreover, the production of vaccines ramped up significantly around the world, and other countries, such as the U.K., Germany, and France, have caught up in terms of vaccination efforts. China accelerated its production as well and has become the most vaccinated large country, administering over 1.2 billion shots through the end of June. Unfortunately, some emerging countries such as Brazil and India continue to struggle with the virus, in part due to low vaccine availability and/or an unwillingness to take the shot.
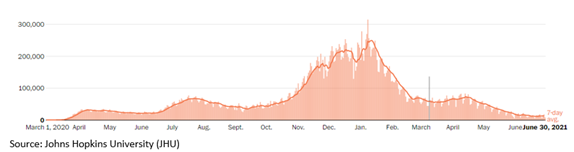
An acceleration of vaccine administration contributed to increased economic activity and a reduction in the number of total cases. At the beginning of 2021, the U.S. was reporting approximately 250,000 new COVID cases daily. That number has fallen more than 96% since, with data as of 6/30/2021 recording roughly 10,000 cases per day.
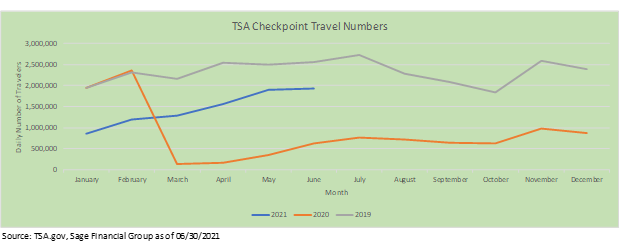
During the onset of the pandemic between February and April of 2020, airline travel was effectively removed from daily activity. Travel demand reached remarkably low levels between government-mandated shutdowns and fear related to the uncertainty of the pandemic. This trend gradually began to reverse at the end of 2020 into the new year, primarily fueled by the vaccine rollout and improved health measures, and more information about the transmission of COVID-19. Moving into the summer months of 2021, consumer spending habits have shifted in favor of leisure activities, including travel. Illustrated below, as of 06/30/2021, daily TSA Checkpoint data shows that nearly 75% of travel has resumed to levels observed in 2019.
Clinical trials revealed that both Pfizer and Moderna vaccines demonstrated greater than 95% efficacy. The primary concern at this point has focused on the vaccines becoming ineffective when combating variant strains of COVID-19. Variants remain a risk in the second half of the year, but data as of the time of writing in early July still shows that vaccines remain effective against the known new strains. Further, the FDA and vaccine companies are prepared to release booster shots without the typical three-phase trial process.
From a financial market perspective, effective vaccines are a clear positive as they boost reopening and economic activity. We think that normalization can remain a tailwind for equity markets, as corporate profits will likely continue to experience strong growth, although traditional fixed-rate bonds may be challenged if interest rates rise to pre-pandemic levels.
Consumer Spending Driven by Pent-up Demand
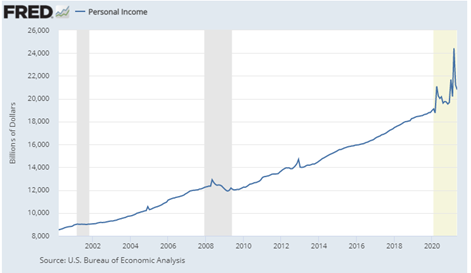
At the beginning of the year, we wrote that “In a typical recession, income growth declines for workers as the labor market becomes weaker and employers avoid raising wages and decrease hiring.” But this time, in contrast, the “amount of fiscal stimulus provided in the 2020 COVID-induced recession has kept personal income growth higher than pre-recession levels. This trend continued with the passage of a massive $1.9 trillion stimulus package in February, which included $1,400 checks to people under a certain income threshold. As a result, rather than the decline in personal income typical during a traditional recession, personal income rose during the COVID recession.
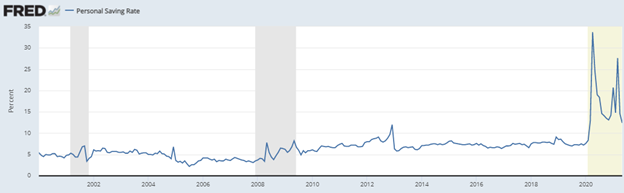
This increase in income was accompanied by a decline in the ability or desire for many consumers to travel, go out to dinner, etc., which led to increased savings. Therefore, a key metric that should remain closely watched is the “personal saving rate,” which captures the amount of income workers save and spend. In June 2021, the personal savings rate hit its highest level in the 61 years of tracked data. While the broad spike in savings has passed, the latest reading of 12.4% is the highest savings rate since 1981.
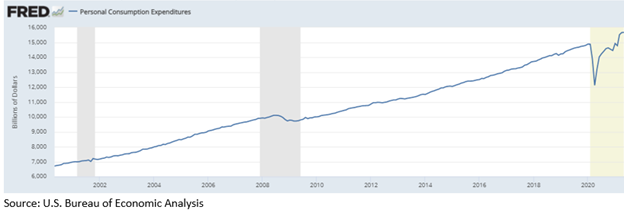
This has created a powerful dynamic as most of the U.S. economy has reopened with individuals having more cash on hand potentially to spend. At the end of May, nearly $15.7 trillion in goods and services were purchased in the U.S. at a seasonally adjusted annual rate.
Strong consumer income, saving, and spending trends point to a continued strong second half of 2021 for consumer spending. Even more encouraging, consumer preferences have shifted towards the services sectors such as restaurants and hotels that were beaten down for the better part of the last 15 months. U.S. consumer spending makes up 70% of economic output and is a primary driver of the global economy as many countries rely on exports to the U.S. (e.g., Germany, China, Brazil, etc.). While direct consumer payments are most likely over, we expect pent-up demand to continue to keep the economy at an above long-term level throughout the rest of 2021 and into 2022. Corporate profits are expected to increase alongside economic growth, providing a positive backdrop for financial markets.
Acceleration of Secular Trends
Turning now from key global macroeconomic factors and their potential impact, in this section, we look at what the pandemic’s effect has been on some secular trends (i.e., those trends that transcend business cycles). The pandemic serviced as a catalyst for several secular trends that were already in motion, most notably a reliance on e-commerce.
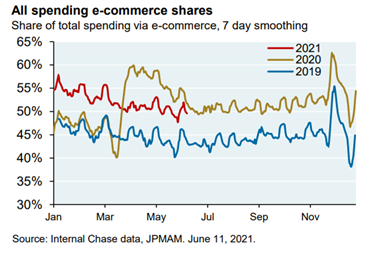
Over the past 20 years, e-commerce has steadily risen as a dominant factor in U.S. retail sales. However, the pandemic brought a multi-year acceleration. As shown below, the e-commerce share quickly rose from 45% of total spending to 60% in just a few days. While it could have been a temporary pop, the 2021 share remains significantly higher than 2019 despite the reopening of most of the U.S. by June of this year. This multi-year acceleration of e-commerce can be seen in the stocks of Amazon, Shopify, Etsy, as well as payment ecosystem companies such as PayPal, Square, etc.
E-commerce is not the only secular trend that was pulled forward several years by pandemic-related disruption. Key areas of the economy were propelled by innovative technology, including telemedicine. Data from the U.S. Department of Health & Human Services reported that the percentage of individuals that received virtual medical care went from almost non-existent in 2019 to nearly 20% in 2020.
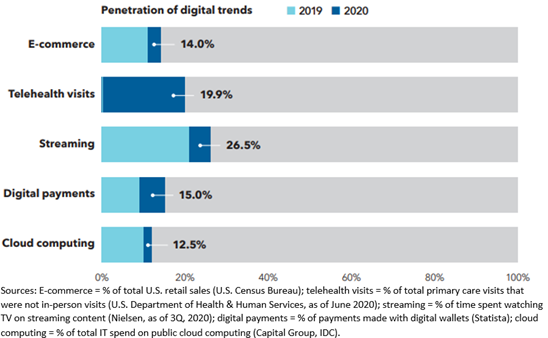
Although the rapid ascent in year-over-year change in some of these digital trends does not appear sustainable, behavioral changes may potentially allow them to remain at 2020 levels over the long term. Many of these digital activities are more convenient and increase the quality of service. This improvement in consumer experience is likely to help permanently shift behaviors in at least some of the categories mentioned above.
Stock market indices that are more technology-focused have been the primary beneficiaries. The U.S. is a great example, as many of the largest companies (Apple, Amazon, Google, Facebook, Netflix, etc.) are highly innovative and technology-focused. China is another country with innovation at the forefront, boasting companies such as Alibaba, Tencent, and Meituan. We position client portfolios in such a way that they are overweight U.S. and Chinese stocks as compared to what we may expect over the long-term. Of course, while this strategy has performed well in the past few years, market returns could be challenged if some of these trends slow or reverse, a possibility which we are considering and would adapt to if necessary.
Inflation
At the beginning of 2021, our central thesis focused on inflationary pressures driving prices upward in the near term before a reversion to long-term averages. We still hold this view to be true. Although prices have spiked higher than we thought likely at the beginning of this year, we expect the price increases to moderate in the second half.
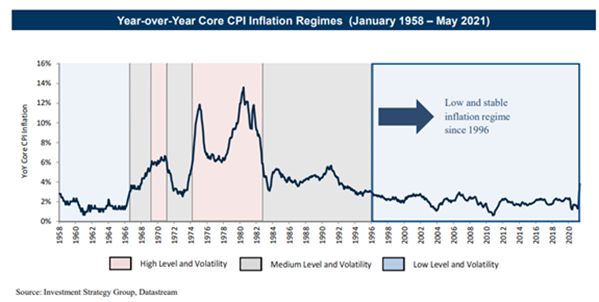
Looking at history, over the last 60 years, the U.S. has faced similarly high periods of inflation only once during the 1970s. Goldman Sachs researchers observed that over the last 25 years, the economy has been in a period of low and stable inflation. In 2020, the U.S. Federal Reserve (Fed) announced a change in policy to hopefully accelerate economic growth and spur more inflation in the economy. Under this framework, the Fed adopted a “Flexible Annual Inflation Target” of 2% over time. This changed suggested that the Fed is willing to let inflation run above 2% for periods of time to counter-balance periods of sub-2% inflation, the rate observed throughout most of the 2020 economic cooldown.
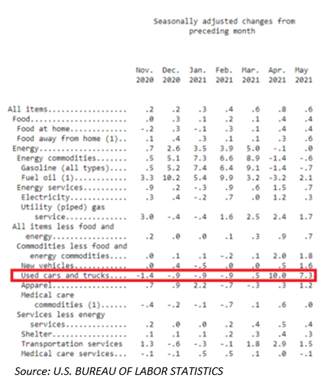
Many recent headlines have focused on inflation striking a 13-year high when measuring the annual change of the consumer price index. But we believe there are mitigating factors at play. For instance, the likely positive long-term, strong consumer demand has shocked the economy, and supply chains are naturally slower to respond. As a result, semiconductor producers, auto part manufacturers, home builders, etc., have struggled to meet demand with fewer products and reduced supply. But there is also a “base effect” related to looking at low prices a year ago amid the height of COVID (e.g., travel & leisure prices were very low in March-June of 2020 due to lockdowns). Thus, some of these price increases are actually due to price declines a year ago amidst the pandemic (i.e., creating a low “base”). Moreover, as shown below, used cars and trucks have had a disproportionate effect on the monthly numbers.
In our view, inflation is a very nuanced topic that requires deep research beyond the headlines. For example, looking at the annualized change in inflation from 2 years ago suggests a true price change of 2.5%, rather than the 5% year-over-year figure frequently cited when the range is limited to a year. Two other key differences between inflation in the 1970s and early 1980s compared to now include demographics and technology.
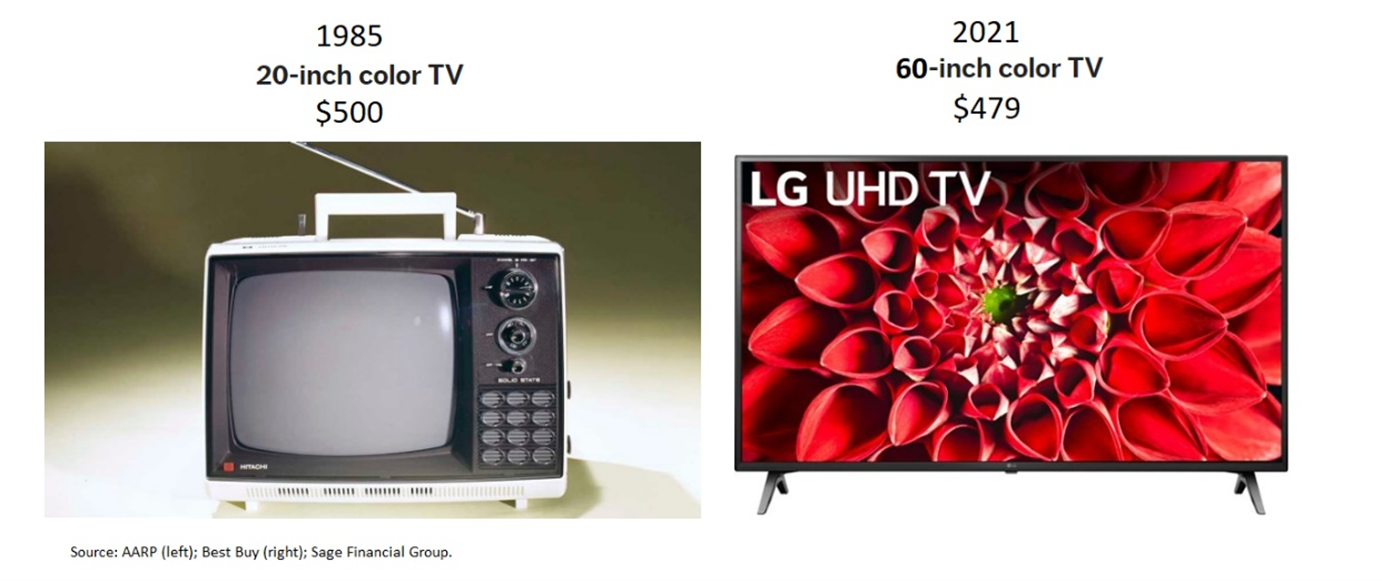
Looking at the population, the U.S. population is older now than it was at that time. The average age of U.S. citizens has increased from by just over 8 years to 38, and the population of senior citizens has doubled to nearly 54.4 million in 2020. An older population has less ability to tolerate price increases due to the fixed nature of their income, which should help keep prices (and inflation) in check. Further, technology has been and likely will continue to be a deflationary force for prices. Consumers now have more ways to compare prices, and innovation/competition drives down prices while improving the quality of products (TVs shown below). The same exercise could be done for phones, computers, and other devices.
In summary, we think that inflationary pressures are largely transitory, with year-over-year inflation figures being higher due to base effects and supply/demand imbalances that will be worked out during the second half of this year. Further, we think that structural headwinds to inflation remain in place, particularly regarding demographics and technology. While inflation certainly remains a risk, if inflation proves to be transitory, bond and equity markets alike will likely respond well (although equity markets are less sensitive to moderate inflation). We would expect growth stocks, in particular, to perform well in a period of continued low inflation.
New Political Regime in the United States
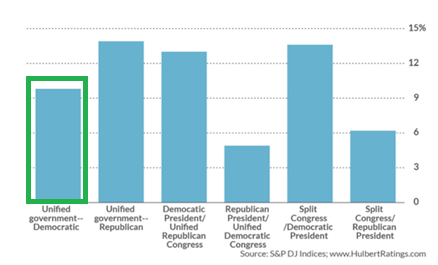
Politics tend to matter in the short term, but throughout American history, the variance we see in returns when regimes change mostly depends on factors other than politics (e.g., economic growth, inflation, innovation, etc.). For example, over history, the difference in control of the Presidency and Congress has led to differences in returns in equity markets, but were positive overall periods and likely influenced by a few years of outsized gains/losses.
In the first half of the year, the Biden Administration and Congress passed additional stimulus through reconciliation in the form of a $1.9 trillion package. The administration is currently negotiating with Congress on an infrastructure bill, although the appropriate measures for funding have limited progress. Initially, the Biden Administration announced a $4.3 trillion package, but that quickly became unviable given the lack of support from Congress, particularly as the economy has improved. However, some further stimulus in the way of infrastructure remains likely. The larger the package, the more likely it is that there may be an increase in taxes. We believe it is possible to see a modest increase in corporate taxes (from 21% to 25%), but it remains unlikely there will be an increase in personal taxes. At the time of writing, the most likely outcomes, in our view, are (1) a bipartisan infrastructure deal of $1 trillion is reached or (2) no infrastructure deal at all. This puts any tax increases in the category of unlikely.
Other Biden-administration agenda items, such as the $15/hour wages and anti-trust actions towards big tech, have not made significant progress in 2021. While many companies have increased their pay without federal requirement, the government mandate has not come to pass. Also, while the FTC and other government agencies have expressed interest in focusing on big tech, the regulatory environment has seemed to become more favorable, as Facebook saw the case against it tossed. In our view, while regulation remains a risk today, consumers receive utility from the products that Amazon, Google, and Facebook offer. In contrast to past monopolies, these companies actually are deflationary and are not directly harming consumers, making it difficult to bring action against them.
Outlook
Many of the trends that we expected to drive financial markets in 2021 have played out as we anticipated, although not precisely in some cases (e.g., inflation has gone higher than most expected). Major forces such as accommodative policy, vaccines driving economic normalization, pent-up demand, and acceleration of secular trends have all driven the global equity markets higher.
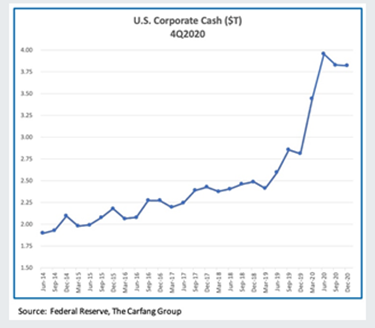
In the second half of the year, many of these trends are likely to continue, with the addition of corporate buybacks to the list of market drivers. As shown below, corporate cash has skyrocketed higher, and we expect companies to accelerate their share repurchase programs, which is likely to provide further support for stocks.
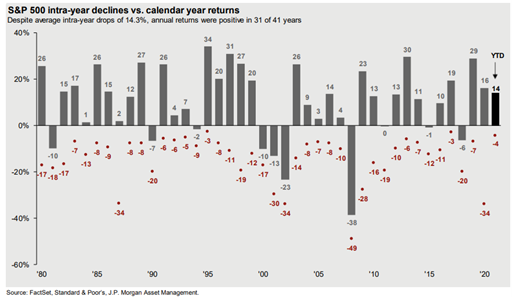
However, while our outlook on the economic backdrop and equity markets remains largely positive, we are not suggesting that the second half of the year will be without volatility. Since the U.S. election, markets have been remarkably stable — in 2021, the largest U.S. Large Cap drawdown has been 4%. Based on historical standards, this is unlikely to be the largest sell-off we see, and we want to remind clients that volatility is part of investing. However, we plan for volatility and build portfolios that anticipate some movement down as well as up in financial markets. In general, we expect that the second half of this year is likely to have a positive economic backdrop and strong company profits, largely due to accommodative monetary and fiscal policy along with the other themes discussed above. According to historical trends, we anticipate positive equity returns.
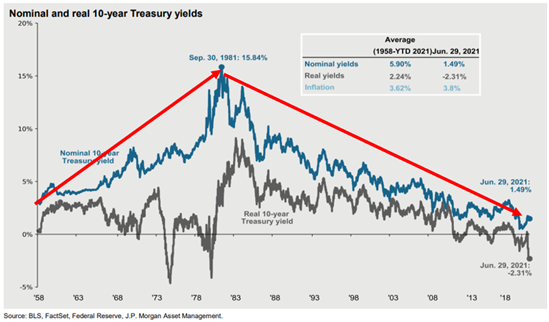
On the fixed-income side, we expect that the continued normalization in interest rates to be the main story. As the main themes mentioned above drive economic growth to 2019 levels and higher, interest rates are likely to continue to move modestly higher as well and closer towards pre-pandemic levels. At the start of the year, the U.S. 10-year yield was 0.70%; it ended the first half of the year at 1.45%. Prior to COVID, the 10-year yield was 1.88%, 0.43 percentage points higher than today. These modestly higher interest rates are likely to continue to weigh on traditional taxable bond returns, which have declined about 1.60% in the first 6 months of the year. Sage’s portfolios are positioned in a way that we think will perform well in an environment with modestly higher rates, primarily by using shorter maturity and flexible bond strategies.
Closing Thoughts
The first six months of 2021 have proven to be positive for financial markets and client portfolios. Accommodative monetary and fiscal policy, a successful albeit uneven global vaccine rollout, pent-up consumer demand, and secular trends have driven equity markets higher and interest rates modestly higher. We continue to recognize that we are in an unprecedented period as the economy recovers from the global pandemic and government spending policies create some unnatural situations. The uncertainty related to these “uncharted waters” could lead to volatility in the financial markets, although we want to stress that volatility is a normal and expected part of investing.
Regarding inflation, our current base-case scenario is that the inflationary pressures will be transitory. Nonetheless, we recognize that higher prices are a risk and have already incorporated strategies into portfolios to address inflation, including diversified bond strategies. Further, equities tend to do well in periods of modestly higher inflation as companies have pricing power. However, we want to prepare you for the fact that inflation measures are likely to fluctuate throughout the year and caution against reading too much into any one data point. Accordingly, we are closely watching the “tea leaves” of inflation and closely monitoring the potential impact on economic growth and the financial markets.
RELATED POSTS
June Insights: Economic Growth & Inflation, COVID Developments, and Diversified Portfolios
Sage Recognized Nationally and Regionally
The information and statistics contained in this report have been obtained from sources we believe to be reliable but cannot be guaranteed. Any projections, market outlooks or estimates in this letter are forward-looking statements and are based upon certain assumptions. Other events that were not taken into account may occur and may significantly affect the returns or performance of these investments. Any projections, outlooks or assumptions should not be construed to be indicative of the actual events which will occur. These projections, market outlooks or estimates are subject to change without notice. Please remember that past performance may not be indicative of future results. Different types of investments involve varying degrees of risk, and there can be no assurance that the future performance of any specific investment, investment strategy, or product or any non-investment related content, made reference to directly or indirectly in this newsletter will be profitable, equal any corresponding indicated historical performance level(s), be suitable for your portfolio or individual situation, or prove successful. Due to various factors, including changing market conditions and/or applicable laws, the content may no longer be reflective of current opinions or positions. All indexes are unmanaged and you cannot invest directly in an index. Index returns do not include fees or expenses. Actual client portfolio returns may vary due to the timing of portfolio inception and/or client-imposed restrictions or guidelines. Actual client portfolio returns would be reduced by any applicable investment advisory fees and other expenses incurred in the management of an advisory account. Moreover, you should not assume that any discussion or information contained in this newsletter serves as the receipt of, or as a substitute for, personalized investment advice from Sage Financial Group. To the extent that a reader has any questions regarding the applicability above to his/her individual situation of any specific issue discussed, he/she is encouraged to consult with the professional advisor of his/her choosing. Sage Financial Group is neither a law firm nor a certified public accounting firm and no portion of the newsletter content should be construed as legal or accounting advice. A copy of the Sage Financial Group’s current written disclosure statement discussing our advisory services and fees is available for review upon request.
Sage Financial Group has a long track record of citations and accolades. Rankings and/or recognition by unaffiliated rating services and/or publications should not be construed by a client or prospective client as a guarantee that s/he will experience a certain level of results if Sage is engaged, or continues to be engaged, to provide investment advisory services. Nor should it be construed as a current or past endorsement of Sage by any of its clients. Rankings published by magazines and others generally base their selections exclusively on information prepared and/or submitted by the recognized advisor. For more specific information about any of these rankings, please view our Accolades or contact us directly.
© 2021 Sage Financial Group. Reproduction without permission is not permitted.