January was a mixed month for stocks and bonds, following the high bar set by their formidable performance in the final two months of 2023.
Much of the strong rally at the end of last year was driven by the expectation that the Federal Reserve had completed its two-year initiative to restore price stability in the U.S. through higher interest rates.
While the markets’ robust performance at the end of 2023 did not carry over into the start of 2024, the anticipation of lower interest rates and expectations around economic growth and corporate earnings continue to exert a positive influence on the markets and investor sentiment.
In this edition of Insights, we review market performance, highlight the health of the U.S. economy, analyze recent inflation trends, and share our perspective on the impact presidential elections have on the markets.
As always, our goal is to provide transparent insight into our thinking and how we seek to help you achieve your investment and financial goals.
Market Overview
Market participants digested a significant number of economic reports in January. For the most part, the data was constructive on the health of the U.S. economy. Economic growth was faster than expected, inflation readings continued declining, and the heavily analyzed labor market showed no material deterioration.
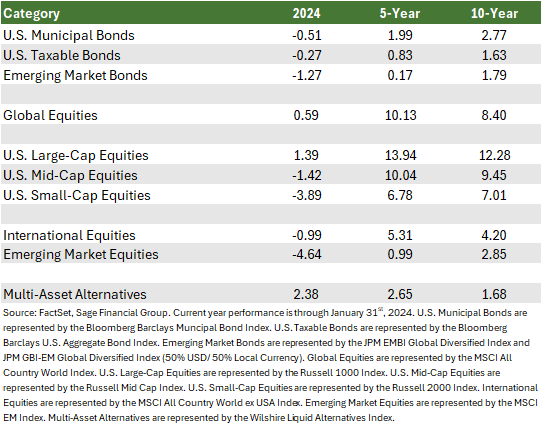
Core bond returns relented in January after experiencing two consecutive months of gains, declining by 0.27%, partly due to longer-term Treasury yields rising throughout the month as incoming data reinforced economic resilience. Shorter-term yields experienced less change as investors debated “when” and “not if” rate cuts were coming. Fed Governor Christopher Waller gave a speech towards the middle of the month and stated, “Rates should be lowered methodically and carefully.”
Emerging market bonds also declined in January, falling 1.27%. Last year, the asset class climbed 11.90% as many emerging market central banks began to lower their domestic policy rates. At the end of January, three South American countries (Brazil, Chile, and Colombia) all lowered policy rates. Lower rates in the U.S. can make these countries more inclined to lower rates, given the reduced likelihood of currency depreciation.
Globally, equity markets were mixed in January.
U.S. large-cap equities continued to be a top-performing asset class, rising 1.39% in January. The S&P 500 marked several new all-time highs during the month, reaching a peak price level of 4,929 on January 30th.
U.S. mid and small-cap stocks displayed negative performance, with declines of 1.42% and 3.89%, respectively. These follow strong gains in December as market participants began anticipating rate cuts from the Fed. Healthy economic data throughout January has made rate cuts in March less certain and tempered expectations. We anticipate that clarity regarding the timing of interest rate adjustments and developments around corporate earnings should bolster these segments.
International equities, represented by the most widely referenced index[1], retreated 0.99%, and emerging markets equities fell 4.64% in January. European stocks remain closely intertwined with developments in China, where there was a surge in equity selling and a decline in investor confidence at the beginning of the month. However, this trend reversed later when luxury goods company LVMH reported strong sales in China and the People’s Bank of China made a surprise decision to cut rates to support the economy via increased bank lending.
Economic Growth in Motion Stays in Motion
Entering 2023, economists and investors heavily debated the likelihood of an impending U.S. economic recession. The crux of the discourse revolved around expectations that higher interest rates would create tighter financial conditions and impact the economy negatively.
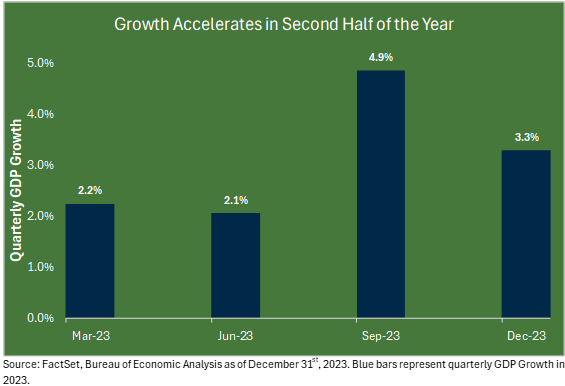
A year removed from these outlooks, the U.S. macroeconomic backdrop has demonstrated greater resilience than many expected. Despite the U.S. Federal Funds rate being at its highest since August 2007, U.S. Real GDP grew by 3.3% in the 4th quarter of 2023.
Real GDP is reported quarterly by the U.S. Bureau of Economic Analysis. The report is a comprehensive measure of U.S. economic activity, and changes are a popular indicator of overall economic health.
When we assess the state of the U.S. economy, taking stock of the U.S. consumer is a natural starting point. Given that this consumption represents approximately two-thirds of the U.S. economy, it is an important indicator of economic momentum. U.S. household spending rose meaningfully in November and December 2023, beating expectations. We believe that falling inflation relative to goods and services helped drive this uptick in spending.
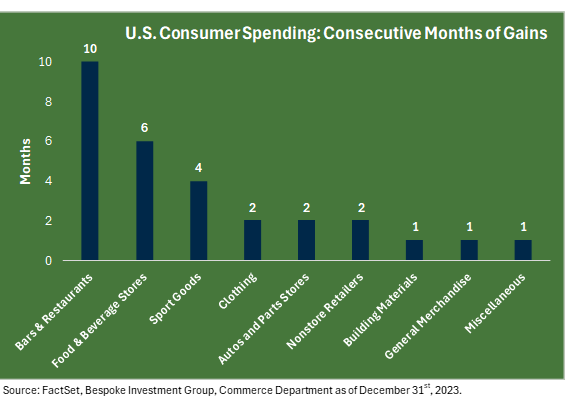
At this point, the U.S. consumer has shown tremendous resiliency as well as an appetite to go out and spend discretionary income. Six of the thirteen sectors included in the monthly Retail Sales data reported at least two consecutive months of gains in spending.
Bars and restaurants have seen 10 consecutive months of increased consumer spending, which marks the second-longest streak on record. Put simply, consumers are spending on experiences with no apparent end in sight.
The continuous influx of positive economic data underscores the robustness of the U.S. economy, primarily driven by healthy U.S. consumer sentiment. As evidenced in the final months of 2023, financial markets can respond quickly to new information. We continue to be impressed and admire the strength of the U.S. economy, though we temper this excitement with a balanced approach.
As we proceed deeper into 2024, we continue to like the risk-reward tradeoff offered by core investment-grade bonds. In suitable portfolios, we strategically added to this category in the second half of 2022 and throughout 2023. The higher credit quality and enhanced income potential from investment-grade bonds allow them to absorb sudden market volatility, thus providing diversification during turbulent times. At the same time, our portfolios maintain an intentional allocation to U.S. stocks, where appropriate, to capitalize on potential market upswings.
Inflation Finds Its Level
With economic growth exhibiting resilience and inflation continuing to decline, we appear to remain on course for a “soft landing.” Despite the Federal Reserve’s endeavors to deflate the U.S. economy amidst ballooning inflation, a sudden “pop” has yet to surface.
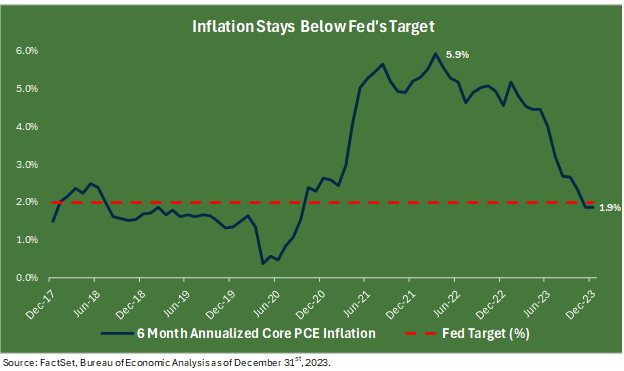
The most recent reading of the Fed’s preferred measure of inflation, the Personal Consumption Expenditures (PCE) Index, showed a 6-month annualized increase of 1.9%. This marked the second consecutive month of core PCE inflation (excluding food and energy), remaining below the Fed’s long-term target of 2.0% on a 6-month annualized basis, a trend we have not observed since late 2020.
If core PCE remains below the 2% inflation target for several months, it would bolster the Fed’s confidence that higher interest rates have helped curb inflationary pressures. In turn, the Fed should begin to lower interest rates as inflation levels remain between 2% and 3%, year-over-year.
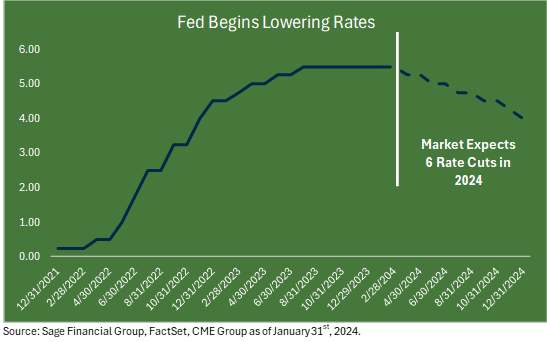
Throughout January, the probability of the Fed beginning to lower its policy rate decreased from approximately 90% to a 40% probability in March. The market and the Fed have accepted that rate cuts are coming, but the cadence and timing remain up for interpretation. Policymakers want to avoid cutting too early and seeing a spike in inflation or waiting too long and the economic environment deteriorating.
We are taking a more cautious approach. We believe the process will be more gradual, with an expected 5 rate cuts in 2024, allowing the Fed to continue into 2025. This avoids pausing rate cuts or, worse, raising rates again.
Tying this to markets, assets like equities and credit instruments should perform favorably if inflation continues to decline and the Fed cuts rates as expected. A preemptive decline in interest rates provides valuation support for riskier assets like stocks and would be a tailwind for the M&A market in asset classes such as commercial real estate and private equity.
Likewise, fixed-income prices would benefit from lower yields. Historically, cash has been an underperforming asset class in periods following a final Fed rate hike as money markets see asset outflows in anticipation of the Fed cutting rates.
To prepare for this more favorable environment, Sage recommended that suitable clients add to small and mid-cap stocks in February 2023. Smaller businesses are particularly sensitive to interest rate fluctuations compared to large-cap companies. Consequently, we expect that once the Fed does begin to lower rates, small-cap stocks will enjoy a strong tailwind as debt becomes more manageable.
The timeline of the European Central Bank lowering interest rates remains unclear. Like the U.S., inflation continues to trend downward, but policymakers are paying close attention to wages before cutting rates. If policymakers in Europe become convinced inflation has moderated, rate cuts towards the middle of 2024 could provide a strong tailwind for European stocks and bonds.
Within Emerging Markets, three South American countries (Brazil, Chile, and Colombia) lowered policy rates as inflation stabilized. China surprised markets with stimulative policies for both their domestic real estate sector and stock markets. Continued fiscal support from China’s government would likely improve investor sentiment.
At the same time, we recognize the importance of maintaining bonds as a portfolio diversifier to mitigate unforeseen volatility in equity markets.
Longer-Term Perspective: Elections Matter, But Not as Much as We Think
In November, the U.S. electorate will go to the polls and cast a ballot in support of a presidential candidate alongside congressional and local candidates. A lot can develop over the next nine months or so.
Our goal has always been to help clients achieve their investment objectives through discipline and focus on their goals.
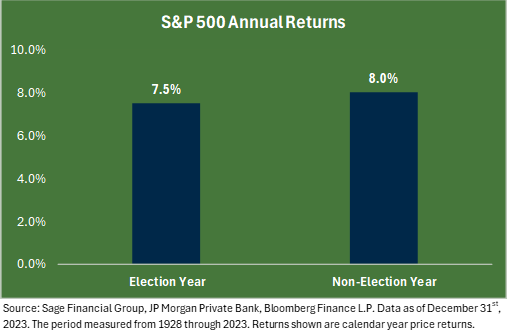
Historical data shows little difference between Presidential election years and non-election years. Looking back to 1928, this 96-year period reveals that the average return of the S&P 500 during election years has been 7.5%. This compares to 8.0% during non-election years.
This is not to say the year will certainly be smooth sailing. Election years can be more volatile, which can cause investors to become uneasy and feel concerned about the value of investment portfolios. But it is most important to remain focused on your goals and keep a historical perspective during times of volatility. Thus, we stress the importance of time in the market rather than timing the market to avoid portfolio loss.
Our fundamental message is that prevailing economic conditions, company earnings, interest rates, etc., impact financial market performance far more than elections. We strongly discourage against adjusting portfolios in reaction to short-term electoral dynamics, which may jeopardize long-term investment objectives.
As we shared in our 2024 Sage Outlook, we believe non-election-related themes to have the most meaningful impact on the broader economy and, subsequently, financial markets, including global monetary policy, cash coming off the sidelines, and economic productivity.
Closing Thoughts
In summary, January provided a mixed first month of the year. While financial markets and the economy remain interconnected, they operate differently from time to time. Financial markets reflect investors’ collective sentiment and outlook regarding asset valuation, whereas economic growth offers a snapshot of production and consumption trends across countries and regions.
In 2024, we anticipate forthcoming rate cuts and expect sustained growth in corporate earnings. We remain mindful of the dynamic nature of the investment landscape and endeavor to prepare diligently for a range of potential outcomes.
In Sage’s 35 years, we have experienced numerous market cycles marked by peaks and troughs. Consequently, we maintain a measured approach, refraining from undue exuberance or trepidation induced by short-term market fluctuations. Our ongoing focus revolves around the diligent analysis of incoming data and strategic positioning of our clients’ portfolios to help them achieve their goals.
[1]Emerging markets debt is represented by the JPM EMBI Global Diversified Index and JPM GBI-EM Global Diversified Index (50% USD/ 50% Local Currency). U.S. large-cap stocks are represented by the Russell 1000 Index. U.S. small-cap stocks are represented by the Russell 2000 Index. International stocks are represented by the MSCI All Country World ex USA Index. Emerging market equities are represented by the MSCI EM Index.
Previous Posts
- Sage 2024 Annual Letter
- Sage 2024 Investment Outlook
- Our Perspective: The Recent Market Rally
- Sage Insights: A Month of Optimism
- Sage Recognized By Leading Financial Journals
Learn More About Sage
Disclosures
The information and statistics contained in this report have been obtained from sources we believe to be reliable but cannot be guaranteed. Any projections, market outlooks, or estimates in this letter are forward-looking statements and are based upon certain assumptions. Other events that were not taken into account may occur and may significantly affect the returns or performance of these investments. Any projections, outlooks, or assumptions should not be construed to be indicative of the actual events that will occur. These projections, market outlooks, or estimates are subject to change without notice. Please remember that past performance may not be indicative of future results. Different types of investments involve varying degrees of risk, and there can be no assurance that the future performance of any specific investment, investment strategy, product, or any non-investment-related content referred to directly or indirectly in this newsletter will be profitable, equal to any corresponding indicated historical performance level(s), be suitable for your portfolio or individual situation or prove successful. Due to various factors, including changing market conditions and/or applicable laws, the content may no longer reflect current opinions or positions. All indexes are unmanaged, and you cannot invest directly in an index. Index returns do not include fees or expenses. Actual client portfolio returns may vary due to the timing of portfolio inception and/or client-imposed restrictions or guidelines. Actual client portfolio returns would be reduced by any applicable investment advisory fees and other expenses incurred in managing an advisory account. Moreover, you should not assume that any discussion or information contained in this newsletter serves as the receipt of, or as a substitute for, personalized investment advice from Sage Financial Group. To the extent that a reader has any questions regarding the applicability above to his/her situation or any specific issue discussed, he/she is encouraged to consult with the professional advisor of his/her choosing. Sage Financial Group is neither a law firm nor a certified public accounting firm, and no portion of the newsletter content should be construed as legal or accounting advice. A copy of the Sage Financial Group’s current written disclosure statement discussing our advisory services and fees is available for review upon request.