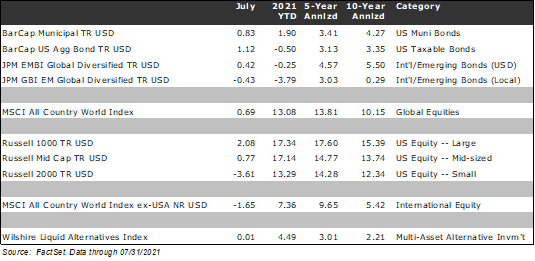
Financial markets were generally stable in July, supported by a positive economic backdrop. The MSCI ACWI Index, which represents global equities (i.e., both U.S. and international stocks), advanced by 0.69% in July, the U.S. large-cap Russell 1000 Index rose 2.08%, the U.S. small-cap Russell 2000 Index fell by 3.61%, and the MSCI ACWI Ex-USA Index (international stocks) fell by 1.65%. Core U.S. taxable bonds represented by the Bloomberg Barclays Aggregate U.S. Bond Index ended the month higher by 1.12%, primarily due to modestly lower interest rates. Municipal bonds also fared well, posting a gain of 0.83% in the month. Overall, corporate earnings boosted equity markets, and a modest lessening of inflation concerns provided a boost for bonds. The markets also appreciated the fact that the U.S. infrastructure spending bill has been pared back. Worsening COVID trends, however, dampened exuberance.
In this edition of Insights, we discuss what we see as the most relevant developments and themes driving financial markets, including (1) U.S. Corporate Earnings, (2) Inflation, (3) COVID trends, (4) Infrastructure Developments, and (5) Chinese Regulatory Crackdown.
U.S. Corporate Earnings
U.S. corporations reported exceptionally strong second-quarter earnings in the second half of July. According to FactSet, with over 70% of the S&P 500 having now reported, the blended year-over-year earnings growth rate stands at 85%, up from the 63% expected for the end of the quarter. The current growth rate is helped by the low starting point as the economy was largely shut down in Q2 of 2020, but the results handily exceeded expectations. Earnings and revenue results have beaten Wall Street consensus expectations in 88% of reports, above their respective five-year averages of 75% and 65%, respectively, and on track for quarterly records.
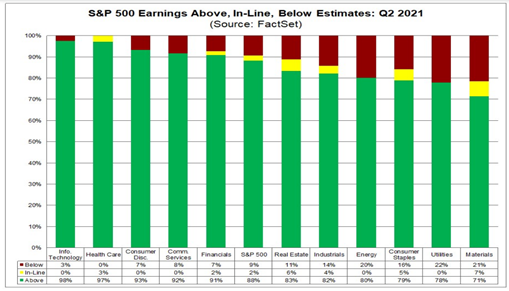
In our view, the Q2 earnings season so far has seen companies from a wide range of industries emphasize a very strong demand backdrop, which resulted in profit margins at historically elevated levels.
Some risks do remain for the rest of the year. Specifically, the impact inflationary pressures could have on profit margins, especially with respect to input costs, labor, etc. Nevertheless, company commentary remains optimistic, and companies with pricing power have fared particularly well (e.g., Google, Chipotle). However, companies that sell more commoditized products have had a more challenging time (e.g., Clorox).
The financial markets may grapple with the potential for continued inflation in the coming months, as well as the potential economic impact of COVID-19 variants. Overall, however, we continue to believe that the backdrop remains positive for equities, particularly as company results remain strong and interest rates continue to be subdued.
Inflation
Inflation continues to be an important topic for financial markets and business leaders. Inflation is critical because if prices rise across the economy, it can put pressure on company profits, consumer spending, and potential Federal Reserve action.
While we recognize that there is a wide range of outcomes, including persistently higher inflation, our base case and the most probable outcome is for the move higher in inflation to be temporary due to (1) base effects, (2) supply/demand normalization, and (3) structural headwinds. The Fed’s response to persistently higher inflation will be more aggressive than if inflation proves to be temporary.
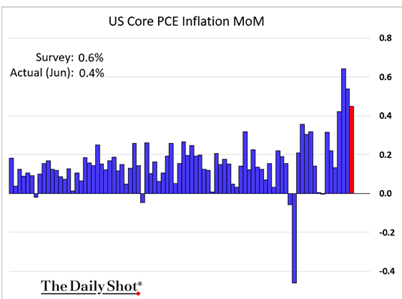
Base effects refer to the lower prices in 2020, which we observed in some categories. CPI and other inflationary figures continue to show high readings year-over-year, following a period of deflation in the spring of 2020 (i.e., the low base of consumer prices a year ago). While the readings may continue to be elevated throughout 2021, we expect the base effects to become headwinds later in the second half of 2021 and into 2022. Recently, we have started to see some deceleration in prices, notably using the Fed’s preferred Core Personal Consumption Expenditures (PCE) inflation gauge. As shown below, month-over-month inflation readings missed expectations in June and have been declining since April.
Second, from a supply/demand perspective, levels are normalizing from a massive shock to both in 2020. All else equal, demand should temporarily exceed supply in many sectors, and unemployment may remain high. Even as wage pressures build, slack in the labor market remains with an unemployment rate of 5.4%, which is significantly better than the 11.1% figure a year ago but is still far above the 3.5% pre-COVID levels of February 2020. As we experienced simultaneous supply and demand shocks in 2020, demand has normalized more quickly than supply due to the faster than anticipated economic rebound and government spending. We expect supply to gradually adjust throughout the second half of 2021 and early 2022. Pent-up demand is also likely to work its way through the system and normalize from current unsustainable levels later this year.
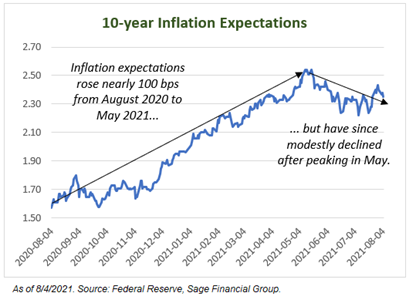
Lastly, we believe that inflation’s structural headwinds include technology driving pricing transparency, globalization of supply chains, increased shale oil supply, a service-based economy, higher debt levels (which suppresses spending), and older demographics. These structural anchors on inflation are likely to weigh down inflation and prevent it from being persistently high. As shown below, market-based inflation expectations have tempered over the past few months, which has helped assuage concerns that this current bout of inflation is more persistent than transitory.
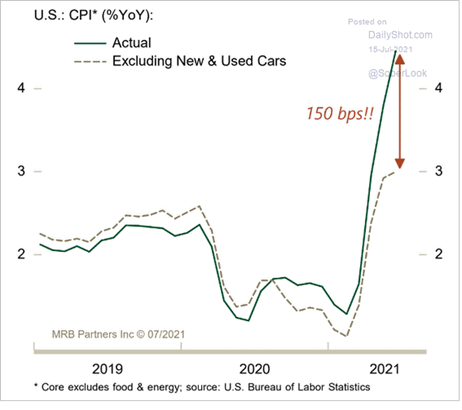
From a Federal Reserve action perspective, a temporary rise in prices is not the type of inflation central banks worry about. Persistent inflation that the Fed wants to stop would need to be seen across most goods and services over a multi-year period. While some market sectors may take a bit longer to normalize supply chains, including semiconductors, we believe most supply/demand imbalances should be worked through in the second half of this year. While some measures of inflation, such as the Consumer Price Index (CPI), are high, simply removing the effects of cars tells a very different story (chart below).
The economic risk that we see currently pertains to inflation rising due to current supply/demand imbalances and subsequently causing consumers’ expectations of inflation to rise (i.e., un-anchoring expectations). There are also some catalysts for inflation that could take place, such as de-globalization and/or a weaker dollar. While our “base case” is that inflation is transitory and will wane towards the end of this year, we do recognize that persistent inflation is possible. We are constantly re-assessing our position and could change our outlook if inflation expectations become unanchored or we see sharp price increases across a broad range of goods and services.
Overall, we seek to build diversified portfolios to perform in a variety of environments and considering a variety of risks, including inflation. High quality, long-duration fixed income would likely perform the worst in periods of inflation and is a component of the portfolio we are actively underweight. Further, we expect equity allocations to protect against modest inflation. We believe this approach will deliver favorable risk-adjusted returns across a variety of market environments. Our diversified portfolio construction philosophy avoids market timing and is designed to withstand pressures impacting financial markets.
COVID Trends
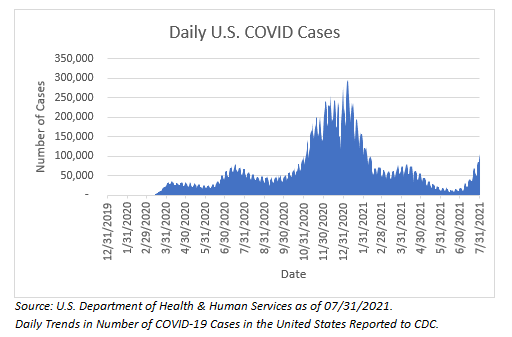
One of the key risks in the ongoing COVID pandemic is that variants are contributing to a sustained rise in cases. Unfortunately, the current Delta variant has shown to be a more contagious strain of COVID and has led to an increase in cases across many countries, including the U.S., U.K., and others. Looking at the U.S., new daily coronavirus infections recently topped 100k for the first time since February, and the 7-day average rose from about 15k cases per day at the end of June to 78k by the end of July.
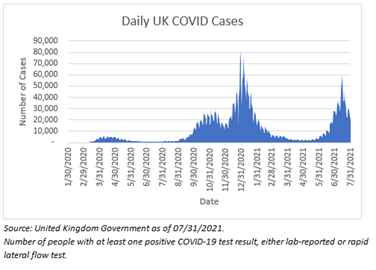
When assessing how this situation might unfold and what it could mean for financial markets, we believe that it is helpful to look at what has happened in other countries that have seen a sustained rise in cases due to the Delta variant. The best comparison is the U.K., although it is not a perfect comparison due to a smaller population and higher vaccination rates (~70% in the U.K. vs. ~60% in the U.S.). As shown below, the number of COVID cases in the U.K. rose significantly over a period of approximately 6 weeks, nearly approaching previous highs.
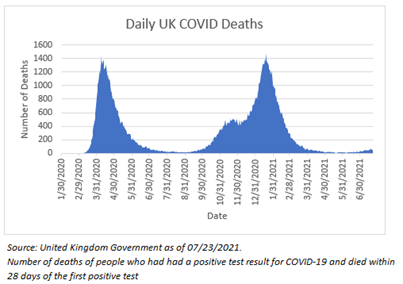
Fortunately, despite the high infection rate, the number of deaths in the U.K. did not move commensurately higher. In our view, it is important to note that vaccines have proven to protect against serious illness from the Delta variant, as more than 98% of new deaths are among the unvaccinated.
From the perspective of the financial markets, stocks and bonds are most sensitive to the economic implications of COVID, including consumer sentiment and government restrictions on activity. It appears likely that persistent COVID cases should continue to rise due to the more infectious nature of the Delta variant. However, mRNA vaccines remain protective against this variant, and leading infectious disease officials remain reluctant to support future lockdown measures, which can be economically destructive. In addition, federal and local governments have broadly avoided further restrictions on economic activity, although some areas have reinstated indoor mask-wearing, per recent CDC guidance. To be clear, the risk exists that cases could rise more than is currently expected, but we are in a different place than a year ago with respect to vaccines and potential booster shots, therapeutics for treating COVID, and a general understanding of the virus.
Infrastructure Developments
The status of the congressionally approved infrastructure plan remains fluid, with several key details needing to be finalized. Towards the end of July, a bipartisan group of U.S. senators introduced a $1 trillion plan, including $550 billion in targeted spending for transportation, broadband, and utility system improvements. The bipartisan plan is expected to be supported by 67 members of the Senate, including 17 Republicans, more than the 60 votes required for passage. From here, the Senate is also likely to pass fiscal year 2022 appropriations to increase the federal budget.
As the bipartisan infrastructure bill makes its way to the House of Representatives, the current Speaker, Nancy Pelosi of California, has expressed a lack of support for the bill in its reduced state. Moreover, at this time, Senate Republicans, as well as a select group of Senate Democrats (e.g., Senators Manchin, Tester, Sinema), conversely do not support the larger $3.5 trillion piece of legislation that would likely raise tax rates. The chart below, from J.D. Supra, breaks down the currently proposed figures and what it would take to pass through the Senate and House of Representatives.
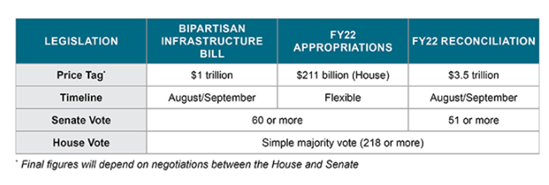
As we mentioned earlier, the situation remains fluid, and the outcome is still uncertain. We do know that enough members of both parties in the Senate have provided support for the smaller $1 trillion piece of infrastructure legislation, but this sentiment is not echoed in the House of Representatives. With 2022 mid-term elections on the horizon in 15 months, both parties are unlikely to make meaningful concessions. As of now, the $1 trillion bill, which has Senate support, does not include higher tax proposals. The larger $3.5 trillion bill could include higher tax rates but does not currently have wide support. If a deal is reached, the size of the bill and magnitude of tax increases is expected to be smaller than the original proposal (i.e., large compromises likely need to occur). We will closely monitor developments and their impact on financial markets to best guide portfolio decisions.
Chinese Regulatory Crackdown
Chinese equities have struggled in recent months. Specifically, the MSCI China Index fell by 13% in July and dragged down emerging market returns overall. In our view, several key dynamics have contributed to the recent volatility with exposure to Chinese companies. From a top-down perspective, the government’s involvement has largely focused on anti-competitive behavior. The Chinese government intervened most recently when they felt companies were not safely securing large data sets, treating their labor force inadequately, and wielding company power to object against the government. Chinese regulators decided to restrict private education companies from making a profit, which renders them essentially worthless in the stock market (e.g., TAL Education fell 70% in one day).
However, following some actions against technology and education companies, Chinese regulators convened most large investment banks and brokers to assure them that recent actions were designed not to limit or restrict foreign capital. This action is widely expected to calm market participants over the coming months.
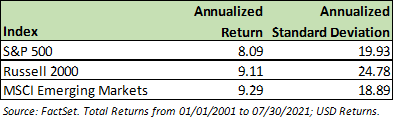
It is too early to predict the impact of the other actions taken by the Chinese government. These challenges are not unique to China, but the policy response has been. The decision to effectively eliminate for-profit after-school education was based on the government’s belief that ultra-competitive schooling may be contributing to China’s declining birth rate in recent years (e.g., widening wealth gap through excess expenses). The current government is interested in making the masses more educated, which in turn should provide for a more skilled and productive labor force. Capital and technological productivity drive GDP growth more so than a large uneducated labor force. Investing in E.M. equities has greatly evolved over the last 20 years. At the turn of the century, China reflected approximately 5% of global GDP. Now it accounts for approximately 20%. From there, the sub-asset class evolved into the BRIC economies, with China eventually coming to dominate the E.M. index. Currently, China represents approximately 40% of the index. The rest of the index is strongly represented by Taiwan, South Korea, and India. Looking below, over this time period, E.M. equities have provided a better annualized return with less volatility over the long term (Source: FactSet. There will be periods of short-term volatility, but we remain constructive on E.M. equities as a diversifier from U.S, Europe, and Japan. These growing economies have expansive middle classes ripened with strong demand to continue their regional growth in a post-COVID world.
Outside of China, pockets of E.M. countries, including Indonesia, Thailand, and Malaysia, have seen a rise in COVID cases that could contribute to near-term performance headwinds. Although on a positive note, cases appear to have peaked in India, with the economy seeming to turn the corner. Through all of the recent challenges, economic growth in India should be a tailwind to the broader E.M. equity complex and portfolio performance.
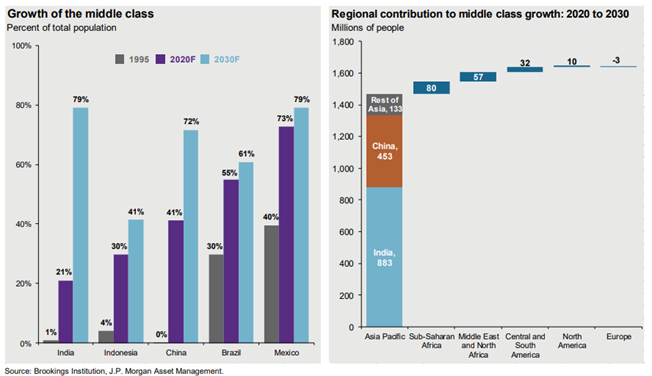
Core to our belief that emerging market equities are worth the risk is the growth in the middle class in Asia, specifically China and India. We continue to believe this growth is a longer-term trend that will occur throughout the rest of the decade, as shown in the chart below to the left. The rise of the middle class is likely to lead to increased consumer spending in these countries, and companies located there should naturally benefit from the increased economic growth and discretionary spending. The chart below to the right is particularly interesting, which shows that 90%+ of the global growth in the middle class is expected to come from Asia.
While investing in emerging markets generally, and China specifically, carries some risks, we continue to encourage investors to stay the course and stick to a long-term plan. Volatility in E.M. equities can be difficult at times, but in our view, E.M. equities are likely to begin to normalize and become more stable in the back half of 2021.
Closing Thoughts
July was a relatively quiet month for the financial markets, but there was a high volume of developments, including strong U.S. corporate earnings, worsening COVID trends, inflationary readings, and Chinese regulatory pressures. There were also some developments with progress made towards a congressionally supported infrastructure bill.
Regarding inflation, our current base-case scenario is that the inflationary pressures should be transitory. Nonetheless, we recognize that higher prices are a risk and have already incorporated strategies into portfolios to address inflation, including diversified bond strategies. Further, equities tend to do well in periods of modestly higher inflation as companies have pricing power. However, we may see inflation measures fluctuate throughout the year and caution against reading too much into any one data point. We believe that our portfolios are invested to take into consideration the wide variety of potential outcomes.
Previous Posts
Revisiting 2021 Themes and Second Half Outlook (July 6th, 2021)
Our Perspective: Current Trends in Inflation (May 24th, 2021)
Learn More About Sage
Disclosures
The information and statistics contained in this report have been obtained from sources we believe to be reliable but cannot be guaranteed. Any projections, market outlooks, or estimates in this letter are forward-looking statements and are based upon certain assumptions. Other events that were not taken into account may occur and may significantly affect the returns or performance of these investments. Any projections, outlooks or assumptions should not be construed to be indicative of the actual events which will occur. These projections, market outlooks, or estimates are subject to change without notice. Please remember that past performance may not be indicative of future results. Different types of investments involve varying degrees of risk, and there can be no assurance that the future performance of any specific investment, investment strategy, or product or any non-investment related content, made reference to directly or indirectly in this newsletter will be profitable, equal any corresponding indicated historical performance level(s), be suitable for your portfolio or individual situation or prove successful. Due to various factors, including changing market conditions and/or applicable laws, the content may no longer be reflective of current opinions or positions. All indexes are unmanaged and you cannot invest directly in an index. Index returns do not include fees or expenses. Actual client portfolio returns may vary due to the timing of portfolio inception and/or client-imposed restrictions or guidelines. Actual client portfolio returns would be reduced by any applicable investment advisory fees and other expenses incurred in the management of an advisory account. Moreover, you should not assume that any discussion or information contained in this newsletter serves as the receipt of, or as a substitute for, personalized investment advice from Sage Financial Group. To the extent that a reader has any questions regarding the applicability above to his/her individual situation of any specific issue discussed, he/she is encouraged to consult with the professional advisor of his/her choosing. Sage Financial Group is neither a law firm nor a certified public accounting firm and no portion of the newsletter content should be construed as legal or accounting advice. A copy of the Sage Financial Group’s current written disclosure statement discussing our advisory services and fees is available for review upon request.
Sage Financial Group has a long track record of citations and accolades. Rankings and/or recognition by unaffiliated rating services and/or publications should not be construed by a client or prospective client as a guarantee that s/he will experience a certain level of results if Sage is engaged, or continues to be engaged, to provide investment advisory services. Nor should it be construed as a current or past endorsement of Sage by any of its clients. Rankings published by magazines and others generally base their selections exclusively on information prepared and/or submitted by the recognized advisor. For more specific information about any of these rankings, please click here or contact us directly.
© 2021 Sage Financial Group. Reproduction without permission is not permitted.