Market Update
The financial markets were mostly down this week, following six mostly positive weeks since the beginning of April. While Investment-grade bonds, as measured by the Bloomberg Barclays U.S. Aggregate Bond Index, finished the week up 0.5%, the S&P 500 finished the week down 2.3%, the technology-focused Nasdaq declined 1.2%, and the small-cap Russell 2000 fell 5.5%. International stocks, as represented by the MSCI ACWI Ex-USA and MSCI Emerging Market Indices, fell by 2.6% and 2.2%, respectively.
The U.S. and many major other countries have entered a transitionary period where re-opening is occurring on a measured, gradual basis. As investors, we continue to closely monitor upcoming catalysts such as (1) the progress of re-opening efforts in the U.S. and abroad, and (2) how the U.S. government policy response, in particular, is evolving. In this week’s summary, we close with a note on how growth- and value-style stocks have fared this year.
The Path of Economic Reopening
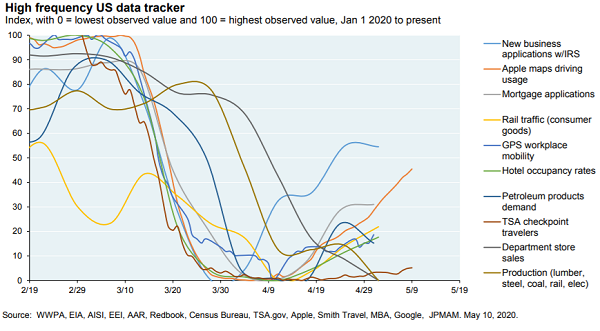
More than one-third of states in the U.S. have begun the slow, arduous process of re-opening their economies. Previously hard-hit countries such as Italy have been slowly re-opening and will allow domestic travel beginning in June. Here in the U.S., states such as Florida and Georgia have seen a steady or moderately declining volume of new cases (as opposed to an exponential increase), which suggests that re-opening in a measured way may be sustainable. Activity tracking indicators, which Google and Apple data provide in real-time, show an uptick in various forms of economic movement following a sharp drop-off into early April (see the graph below). This high-frequency data paints a real-time picture of how the economic recovery may be shaping up and is the sort of information that financial markets will observe closely.
Additional Fiscal Policy Stimulus
This week House Speaker Pelosi introduced a fiscal package of $3 trillion, including cash payouts to citizens and approximately $1 trillion in state aid. While past bills moved through the House and Senate quickly, the size of this bill is hotly contested between the two parties. For example, Pelosi wants to appropriate $1 trillion to states, while Republicans want a much smaller figure due to their stated concerns about the burgeoning the national deficit. Also, Republicans favor tax cuts where Democrats favor cash relief. These are just two examples of how far apart the two sides currently are on cutting what would be the fifth iteration of fiscal policy stimulus by Congress. Still, a bipartisan agreement for a smaller-sized bill (probably between $1 to $2 trillion) remains more likely than not to occur in June.
From an investment perspective, the most important facet of the new stimulus talks is state aid. Many municipalities face unbalanced budgets and fiscal year shortfalls, and they would benefit immediately from direct cash infusions, which could help them avoid reducing services and implementing layoffs. Although several state and local municipalities will wrestle with difficult financial conditions, we do not anticipate wide-scale stress in the core municipal bond market.
Growth vs. Value
One dynamic within the U.S. equity market this year has been the outperformance of growth-style stocks relative to value-style stocks. “Growth” stocks, e.g., infotech and health care, typically have higher growth in revenue and earnings “Value” stocks, e.g., financials and energy, tend to have cyclical business models and so periodically have lower valuations measured by things like price-to-earnings and price-to-book ratios. There are, to be sure, reasons why technology companies (the typical example of growth companies) have done well this year. Various forms of technology applications such as those provided by Amazon, Zoom, Alphabet (Google Classroom), and Netflix have allowed people to buy household goods online, businesses to continue meetings with proper social distancing, schools to continue educating remotely, and everyone to de-stress through entertainment.
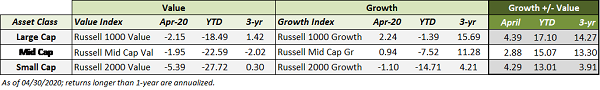
What might be less obvious to many investors is that this relative outperformance of growth stocks over value stocks has been an ongoing trend for most of the last decade. It is not something that just started as a result of the pandemic because growth companies were able to pick up additional customers who needed to find continuity at safe distances. The table below compares the returns of U.S. growth and value indices in April, year-to-date through April, and over the trailing 3 years. The same comparison could be reproduced with similar results for 5+ years.
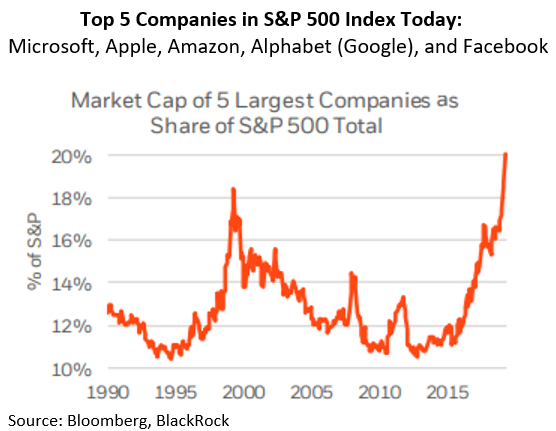
A second takeaway is that most investors are benefiting from this growth. While the S&P 500 Index is not a good benchmark for investors in diversified portfolios to use when evaluating their portfolio returns, most asset allocations include U.S. large-company stocks. Moreover, today five tech-related companies account for about 20% of the U.S. market capitalization in the S&P 500. This means that these companies are having an outsized effect – and generally a positive one – on overall U.S. large-cap stock returns. If an investor owns a large-cap stock index investment blended between growth and value, then he or she is participating in the returns of these growth-oriented companies. In addition, staying diversified in one’s stock allocation means benefiting from this growth style without over-emphasizing growth in case the longer-term trend reverses.
Third, it is possible that the conditions that have contributed to the outperformance of growth stocks over value stocks could continue, although perhaps not smoothly, for some time, and this secular trend has implications for the broad economy. Since 2002 and the end of the recession caused by the tech bubble, U.S. companies have made a massive and persistent investment in software and in information processing equipment (computers). This has led to increases in automation, communication, and remote business activities, which have, in turn, led to lower costs for these and other goods and services, particularly over the last decade. Business investment today is all about asset-light, efficiency-seeking, technological innovation and advancement. This trend is likely to continue, and it is likely to continue to have a disinflationary effect longer-term across much of the economy. This does not mean that there may not be other inflationary forces down the road. But it does mean that technology will likely remain a major and perhaps even greater contributing component of the U.S. economy. It also means that continued technological innovation can help to prevent sharp rises in inflation above the Fed’s long-term target range.
The information and statistics contained in this report have been obtained from sources we believe to be reliable but cannot be guaranteed. Any projections, market outlooks or estimates in this letter are forward-looking statements and are based upon certain assumptions. Other events that were not taken into account may occur and may significantly affect the returns or performance of these investments. Any projections, outlooks or assumptions should not be construed to be indicative of the actual events which will occur. These projections, market outlooks or estimates are subject to change without notice. Please remember that past performance may not be indicative of future results. Different types of investments involve varying degrees of risk, and there can be no assurance that the future performance of any specific investment, investment strategy, or product or any non-investment related content, made reference to directly or indirectly in this newsletter will be profitable, equal any corresponding indicated historical performance level(s), be suitable for your portfolio or individual situation, or prove successful. Due to various factors, including changing market conditions and/or applicable laws, the content may no longer be reflective of current opinions or positions. All indexes are unmanaged and you cannot invest directly in an index. Index returns do not include fees or expenses. Actual client portfolio returns may vary due to the timing of portfolio inception and/or client-imposed restrictions or guidelines. Actual client portfolio returns would be reduced by any applicable investment advisory fees and other expenses incurred in the management of an advisory account. Moreover, you should not assume that any discussion or information contained in this newsletter serves as the receipt of, or as a substitute for, personalized investment advice from Sage Financial Group. To the extent that a reader has any questions regarding the applicability above to his/her individual situation of any specific issue discussed, he/she is encouraged to consult with the professional advisor of his/her choosing. Sage Financial Group is neither a law firm nor a certified public accounting firm and no portion of the newsletter content should be construed as legal or accounting advice. A copy of the Sage Financial Group’s current written disclosure statement discussing our advisory services and fees is available for review upon request.
Sage Financial Group has a long track record of citations and accolades. Rankings and/or recognition by unaffiliated rating services and/or publications should not be construed by a client or prospective client as a guarantee that s/he will experience a certain level of results if Sage is engaged, or continues to be engaged, to provide investment advisory services. Nor should it be construed as a current or past endorsement of Sage by any of its clients. Rankings published by magazines and others generally base their selections exclusively on information prepared and/or submitted by the recognized advisor. For more specific information about any of these rankings, please click here or contact us directly.
© 2020 Sage Financial Group. Reproduction without permission is not permitted.